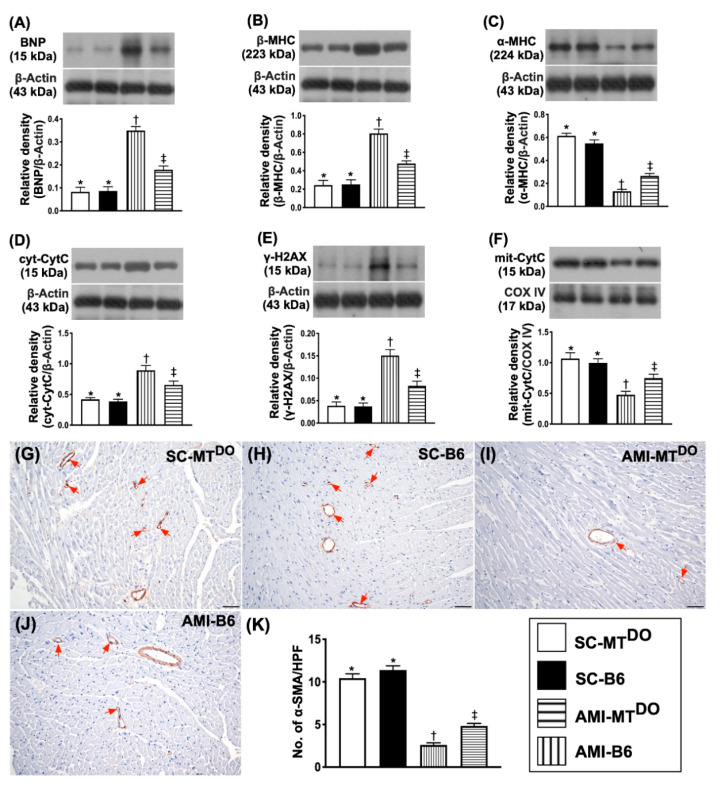
Figure 5.
Protein expression of heart failure/pressure overload and mitochondrial/DNA damage biomarkers in LV myocardium by 60 days after the AMI procedure. (A) Protein expression of brain natriuretic peptide (BNP), * vs. other groups with different symbols (†, ‡), p < 0.0001. (B) Protein expression of β-myosin heavy chain (MHC) protein expression, * vs. other groups with different symbols (†, ‡), p < 0.0001. (C) Protein expression of α-MHC, * vs. other groups with different symbols (†, ‡), p < 0.0001. (D) Protein expression of cytosolic cytochrome C (cyt-CytoC), * vs. other groups with different symbols (†, ‡), p < 0.0001. (E) Protein expression of γ-H2AX, * vs. other groups with different symbols (†, ‡), p < 0.0001. (F) Protein expression of mitochondrial cytochrome C (mit-CytoC), * vs. other groups with different symbols (†, ‡), p < 0.0001. (G–J) Illustrating the microscopic finding (100−) for identification of small vessel density (red arrows). (K) Analytical result of the number of small vessels (i.e., diameter of the vessel ≤ 25 μM), * vs. other groups with different symbols (†, ‡), p < 0.0001. The scale bars in the right lower corner represent 100 µm. All statistical analyses were performed by one-way ANOVA, followed by Bonferroni multiple comparison post hoc test (n = 6 for each group). Symbols (*, †, ‡) indicate significance (at 0.05 level). SC = sham-operated control; MTDO = double knock out of matrix metalloproteinase (MMP)-9 and tissue plasminogen (tPA) in mouse; B6 (i.e., wild type) = C57BL/6 mice. LV = left ventricular; AMI = acute myocardial infarction.

