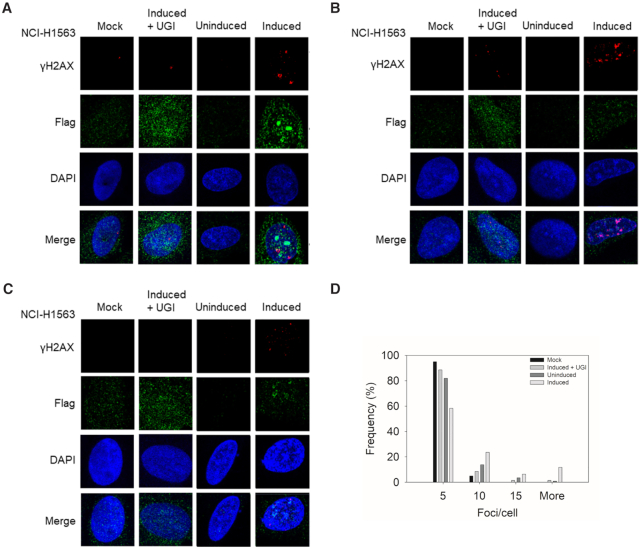
Figure 1.
DNA damage induced by A3H Hap I. (A–C) The γH2AX foci detected by immunofluorescence microscopy in NCI-H1563 cells that were or were not transduced to express a dox-inducible A3H Hap I-Flag protein. Different cell treatment conditions were dox in non-transduced cells (Mock), dox treatment to induce A3H Hap I, but with transfection of a plasmid expressing UGI (Induced + UGI), transduced, but uninduced cells (Uninduced), and transduced and induced cells (Induced). The NCI-H1563 cells were analyzed 24 h after the treatment. Three representative images are shown. (D) Results were quantified and plotted as a histogram. Foci/cell are represented as 1–5 (Bin 5), 6–10 (Bin 10), 11–15 (Bin 15) and ≥15 (More) γH2AX foci/cell.

