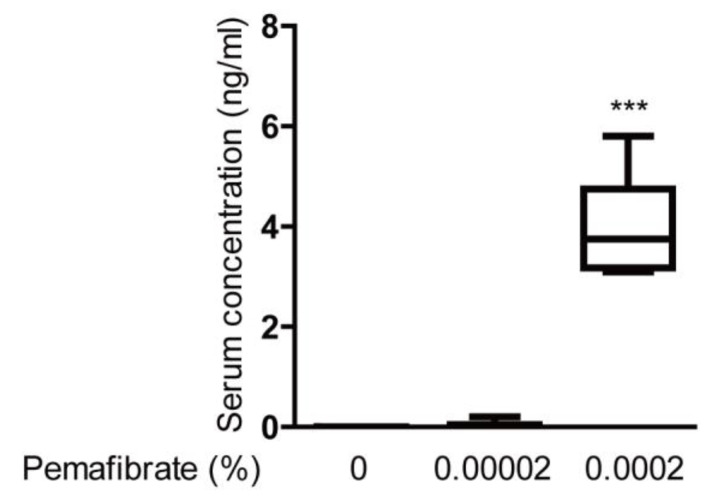
Figure A1.
Detection of serum pemafibrate concentration in the STZ-induced diabetic mouse model. Quantitative analysis showed that serum pemafibrate concentration was constantly detectable after administration of 0.0002% pemafibrate in STZ-induced diabetic mice (n = 6 per group). *** p < 0.001. The graph is presented as median with interquartile range, the 25th and 75th percentile. The data were analyzed using one-way ANOVA followed by a Bonferroni post hoc test.

