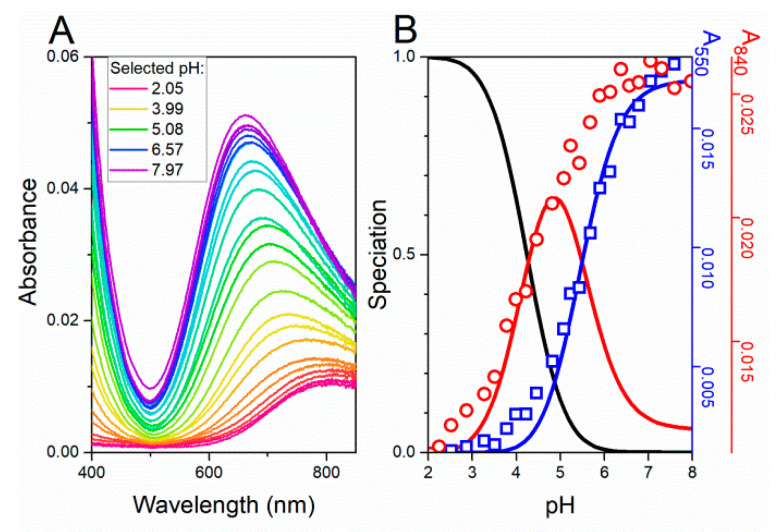
Figure 2.
UV-vis spectra of 4 mM cis-UCA and 0.8 mM CuCl2 titrated in a pH-metric manner. (A) Spectra are colour coded with reds (the lowest pH) to purples (the highest pH). (B) Species distribution of Cu(II) complexes of cis-UCA (red, Cu(cis-UCA); blue, Cu(cis-UCA)2) at 25 °C, calculated for concentrations from UV-vis data (presented on panel A), based on protonation and stability constants shown in Table 1. Left-side axis represents molar fractions of Cu(II) complexes, right side axes stand for absorbance at 550 and 840 nm.

