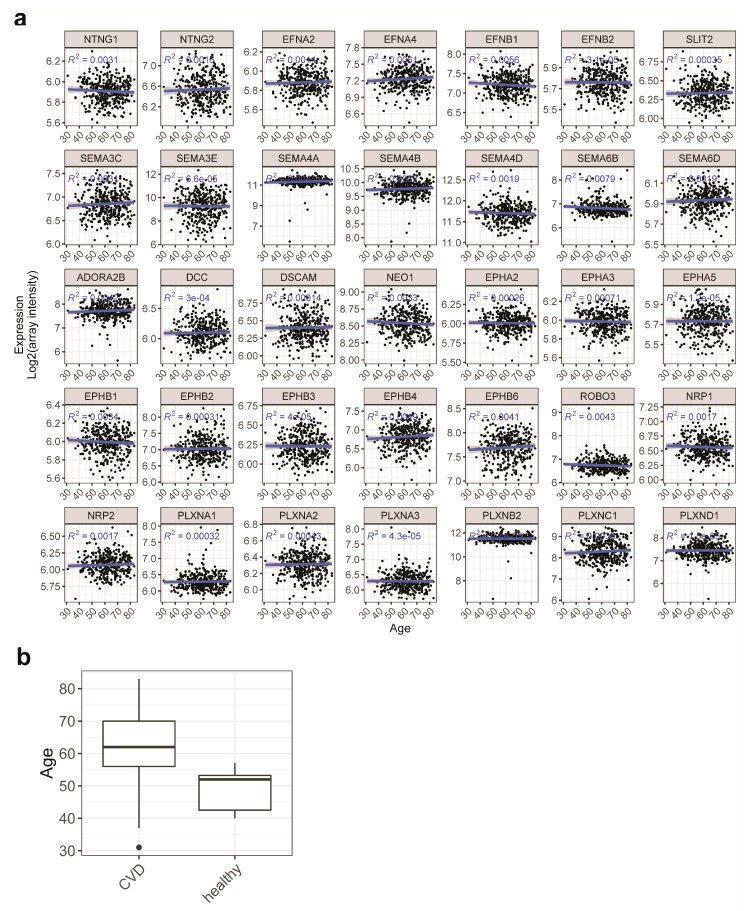
Figure 4.
Influence of age as a potential confounding factor. (a) Scatter plots of expressions of selected NGCs in relation to age were made to show the influence of age on NGC expressions. Linear regressions were done with age being the dependent variable providing the fitted trend line (blue line), the 95% confidence interval of the trend (gray area) and the regression R-squared. Correlations of NGC expressions and age are minimal, as indicated by the R-squared values. (b) Boxplot of age distribution in CVD patients and healthy individuals. Young age dominates in the healthy individuals.

