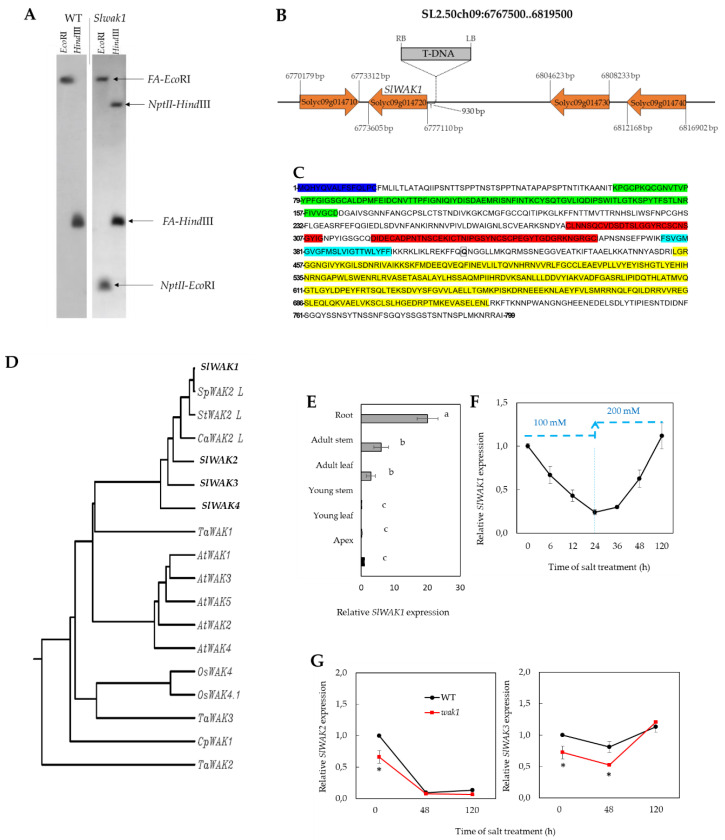
Figure 1.
Identification of the knockout tomato mutant Slwak1. (A) Southern blot analysis to determine the number of T-DNA insertions in Slwak1 mutant using a pool of T2 plants with a chimeric probe that includes the complete coding sequence of the NptII gene fused to 811 pb of the coding sequence of FALSIFLORA (FA) (used as hybridization positive control). Single restriction fragments observed in genomic DNA digested with EcoRI and HindIII indicate the presence of a single T-DNA insertion in the Slwak1 genome. (B) Genomic organization of the WAK cluster in the tomato chromosome 9, composed of four isogenes coding for WAK proteins, and localization of the T-DNA insertion. SlWAK1 gene is tagged by the T-DNA localized 930 bp upstream of the coding region, most probably in the promoter region of this gene. (C) Amino acid sequence predicted from the SlWAK1 gene coding sequence, with predicted conserved protein domains, N-terminal signal peptide and transmembrane region highlighted, identified by making use of diverse bioinformatics tools (see Materials and Methods). In yellow the Ser/Thr kinase catalytic domain (STKc, 455–722 residues), in red the two calcium-binding EGF-like domains (EGF-Ca, 321–364 and 285–311 residues), in green the cell wall-associated receptor kinase galacturonan-binding Cys-rich domain (GUB-WAKb, 65–164 residues), in magenta the N-terminal signal peptide that targets the protein to the secretory pathway (1–15 residues) and in blue the transmembrane domain (377–399 residues). Boxed amino acid (glutamine, position 414) indicated the position where a premature stop codon is generated by a SNP in 12,007 EMS line. (D) Phylogenic tree constructed using rooted tree with branch length (UPGMA), making use of the GenomeNet bioinformatics tools (https://www.genome.jp/tools-bin/clustalw), based on neighbor-joining method after sequences alignment with ClustalW. The homologous sequences of SlWAK1 were retrieved from NCBI and SGN databases or the scientific literature (see Materials and Methods). (E) Spatial expression pattern of SlWAK1 gene in WT plants with six developed leaves grown in control conditions. (F) Time-course analysis of expression of SlWAK1 in roots of WT plants salt-treated with 100 mM NaCl during 24 h and subsequently with 200 mM NaCl from 24 h to 120 h. (G) Expression of two flanking genes SlWAK2 and SlWAK3 in roots of WT and Slwak1 plants after 0, 48 and 120 h of salt treatment (200 mM NaCl). In (E), (F) and (G), values are the mean ± SE of two independent assays, each with three biological replicates. Different lowercase letters in (E) indicate significant differences (LSD test, p < 0.05). Asterisks in (G) indicate significant differences between mean values of WT and Slwak1 (Student’s t-test, p < 0.05).

