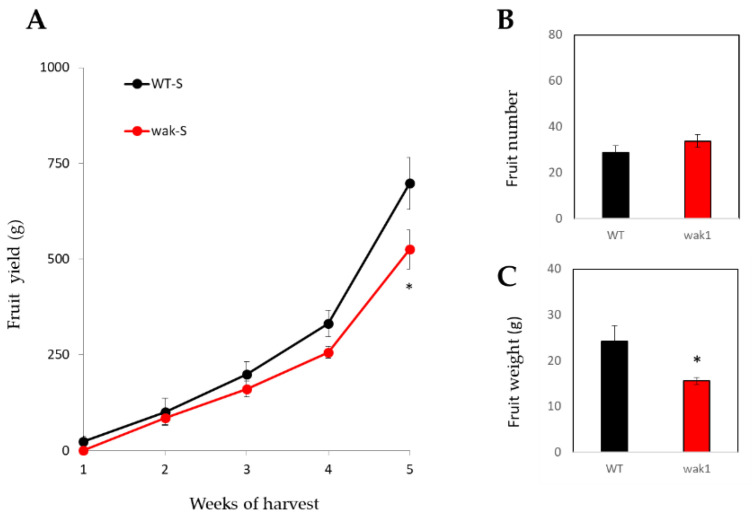
Figure 8.
The null Slwak1 mutant shows salt sensitivity to long term (A) WT and Slwak1 mutant plants were subjected to salt stress (100 mM NaCl), and red fruits were collected for 5 weeks, determining fruit number (B) and (C) fruit weight. Values are expressed as mean ± SE (n = 8). Asterisks indicate significant differences between mean values of WT and Slwak1 (Student’s t-test, p < 0.05).

