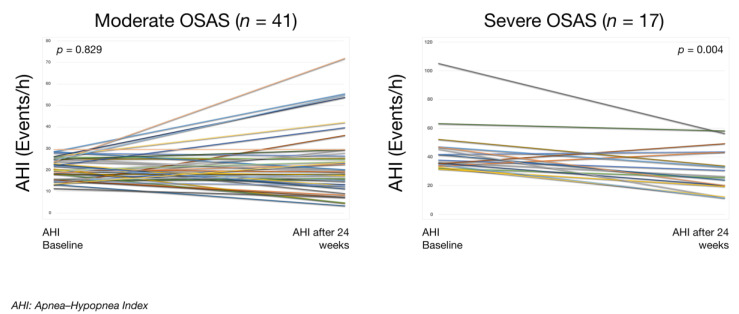
Figure 4.
Apnea–hypopnea index before (baseline) and after a physical exercise program (intervention) in patients with moderate vs. severe OSAS. Each line of different colour represents the individual evolution of AHI for each participant. Within-groups comparison using Wilcoxon’s test for asymmetry distribution. The p-value represents the level of statistical significance of the Student paired t-test for Moderate OSAS and Wilcoxon’s signed-rank test for Severe OSAS.

