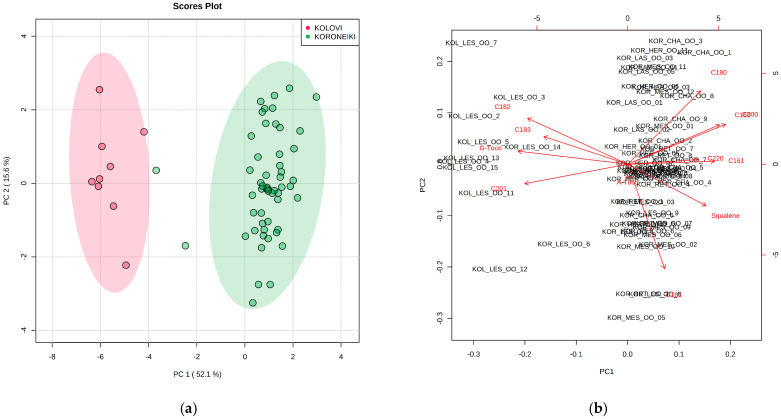
Figure 3.
(a) Principal Component Analysis (PCA) score plot derived from the concentration of fatty acids, squalene, and α-, γ-tocopherol of EVOOs. The legend indicates the two cultivars tested (Koroneiki, Kolovi) and the colored areas represent the 95% confidence region; (b): PCA biplot showing which variables influence the principal components.

