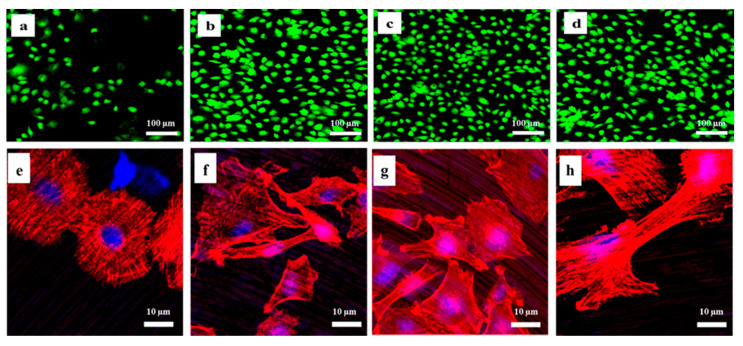
Figure 4.
Immunofluorescence images of attached live mesenchymal stem cells: (a) control (C-P), (b) nitrogen (N-P), (c) air (A-P), and (d) humidified ammonia (NA-P) (scale bar: 100 μm). Immunofluorescence images of the cytoskeleton of the mesenchymal stem cells (MSCs): (e) C-P, (f) N-P, (g) A-P, and (h) NA-P (scale bar: 10 μm). The red color indicates actin filaments, and the blue color shows the nuclei.

