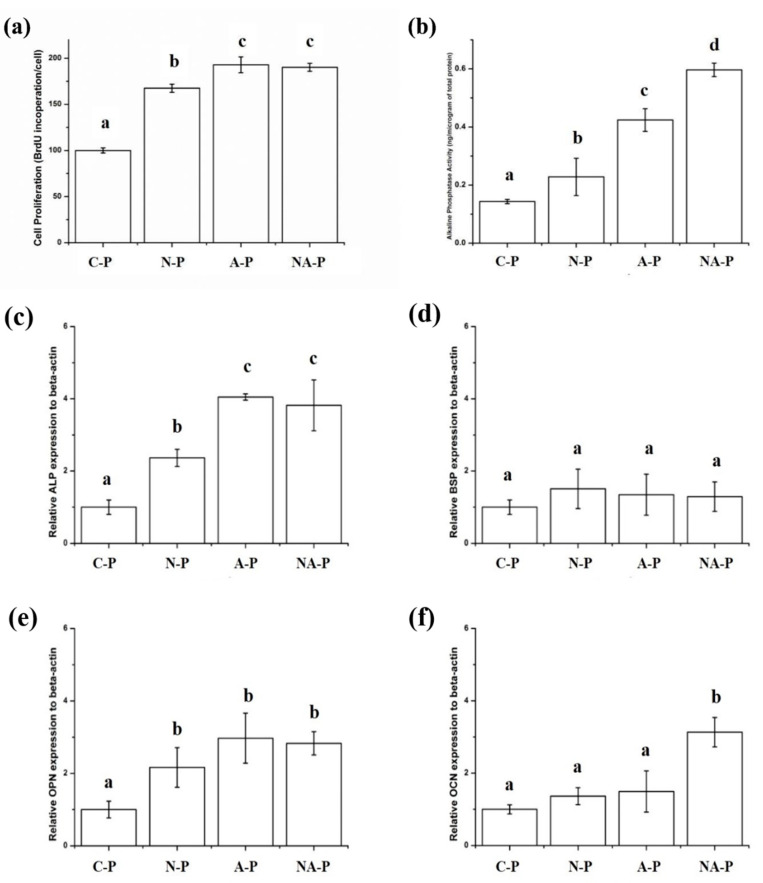
Figure 6.
(a) Cell proliferation rate and (b) alkaline phosphatase activity of human mesenchymal stem cells (hMSCs) cultured on the samples and osteogenic differentiation of hMSCs on the surface of the control and test groups analyzed by qPCR for osteogenic markers: (c) alkaline phosphatase (ALP), (d) bone sialoprotein (BSP), (e) osteopontin (OPN), and (f) osteocalcin (OCN) after culturing for 14 days. All the results are expressed relative to the gene expression of C-P as the control. The same lowercase letter indicates no significant difference (p > 0.05), and different lowercase letters indicate significant differences (p < 0.05). The greater the cellular proliferation or alkaline phosphatase activity or relative gene expression, the higher the letter in alphabetical order (i.e., “b” is significantly greater than “a”, and so on).

