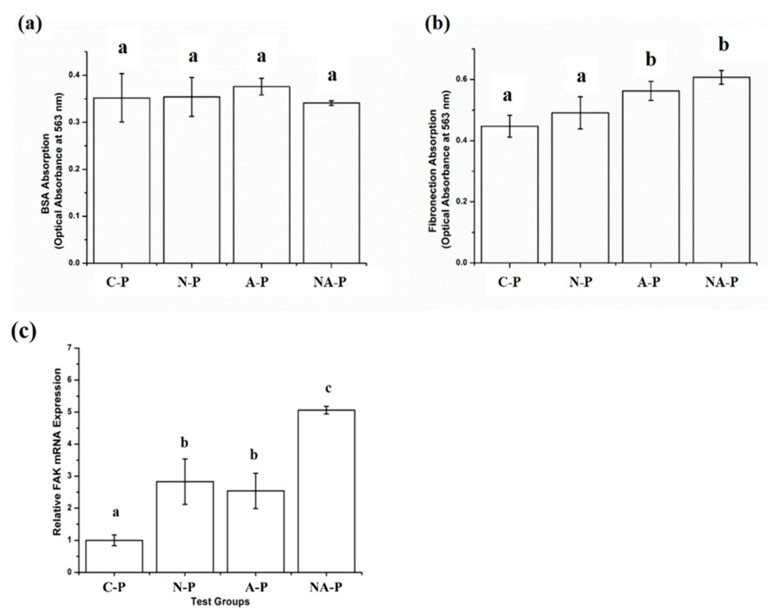
Figure 7.
Protein absorption in the control and test groups for two different proteins: (a) bovine serum albumin and (b) fibronectin. (c) Relative gene expression level of focal adhesion kinase (FAK) in hMSCs cultured on the control and test groups where all the results are expressed as relative to gene expression of C-P as the control: The same lowercase letter indicates no significant difference (p > 0.05), and different lowercase letters indicate significant differences (p < 0.05). The higher the protein absorption or higher the relative gene expression, the higher the letter in alphabetical order (i.e., “b” is significantly greater than “a” and so on).

