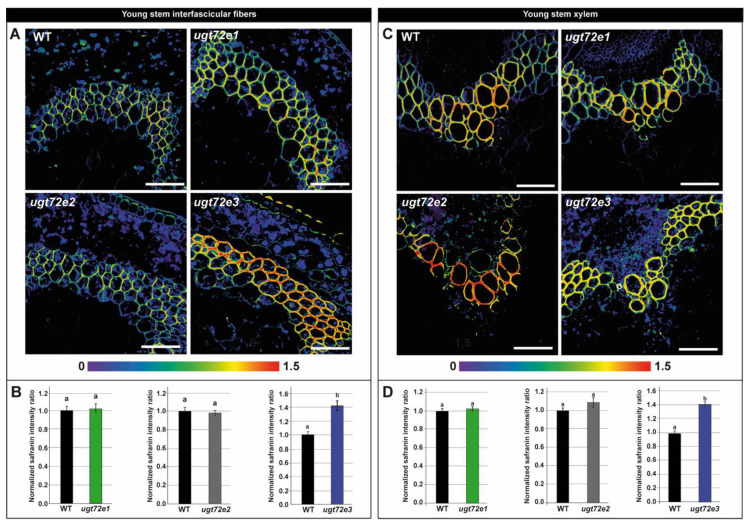
Figure 4.
Local lignin content determination on the young parts of the floral stems using safranin O fluorescence-based method on WT and ugt72e mutants. The safranin O ratiometric images are shown in (A) and (C). The colour range used for image representation varies from the non-normalized ratio 0 (purple) to non-normalized ratio 1.5 (red). Scale bar = 50 µm. Quantification was performed on interfascicular fibers (B) and xylem (D). The normalized safranin intensity ratios (± SD) are represented. Means (± SD) with the same lowercase letters are not significantly different according to Student t-test (p-value < 0.01, n = 3).

