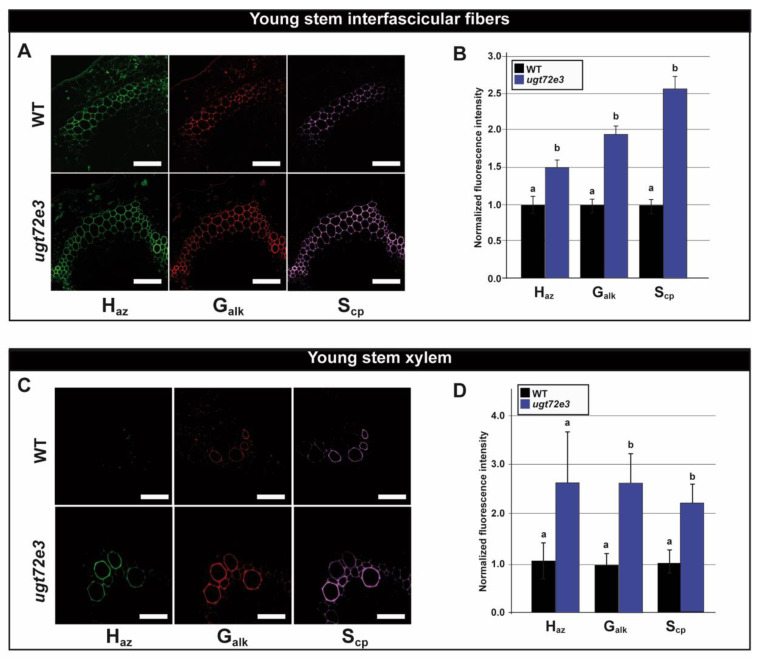
Figure 7.
Monolignol incorporation capacity in the young part of the floral stem. The capacity of cell walls to incorporate monolignols into cell walls was evaluated by measuring the signal of fluorescent probes bound to monolignol chemical reporters metabolically incorporated into the lignin polymer. The tagged monolignol associated incorporation signal was localized in the interfascicular fibers and xylem cell walls (A,C). Haz tagged lignin reporter unit signal appears in green, Galk in red and Scp in purple. Scale bar = 50 µm. The associated incorporation signal was quantified in ugt72e3 and compared to the WT (B,D). Means (± SD) with the same lowercase letters are not significantly different according to Student t-test (p-value < 0.01, n = 3).

