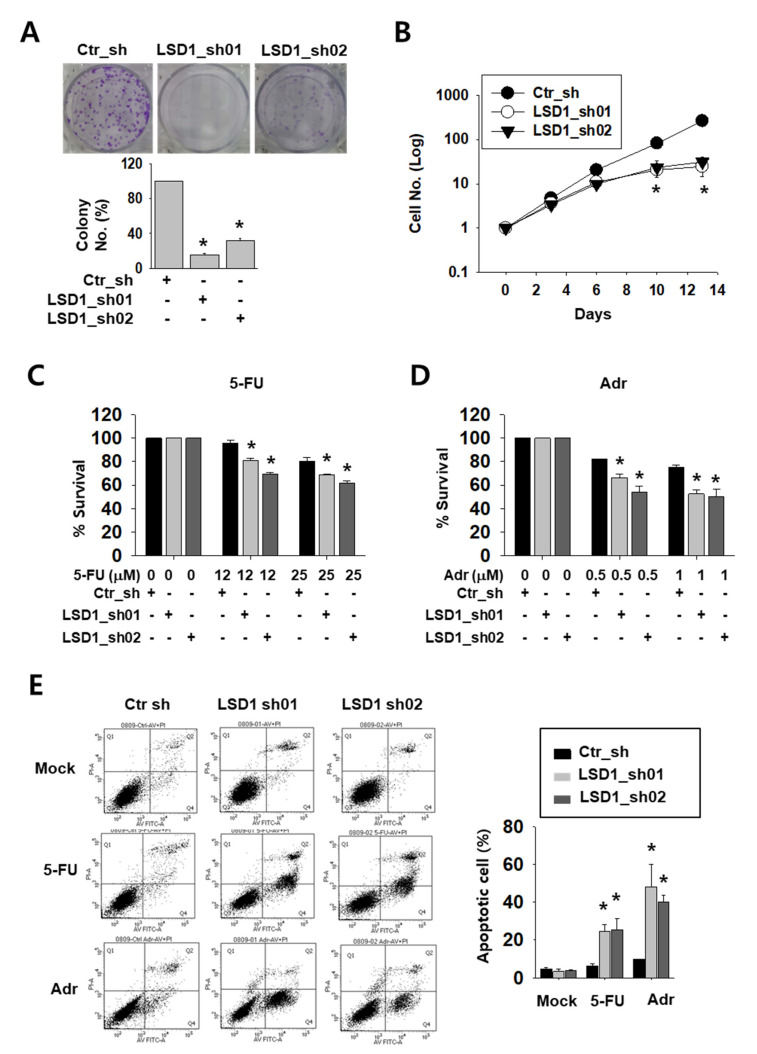
Figure 2.
LSD1 knock-down reduces cell proliferation and increases the effect of anti-cancer drugs on growth reduction in kidney cancer cells. (A) Crystal violet staining for colonies from the same number of indicated short hairpin RNA (shRNA)-expressing Caki-2 cells. The average number of colonies was counted and is shown in the lower graph. Bars represent the means ± SD of three independent experiments, and * denotes p < 0.05 (Student’s t-test) versus the ctr_sh group. (B) The growth curve of control and LSD1 shRNA-expressing Caki-2 cells. Cells were counted on the indicated day and the cell numbers were evaluated. The results are shown as the mean ± SD of three independent experiments, and * denotes p < 0.05 (Student’s t-test) versus the ctr_sh group. (C,D) Cell viability of control or LSD1 knock-down Caki-2 cells after treatment with 5-fluoro-uracil (5-FU) (C) or adriamycin (D) at indicated concentrations. Relative optical density values were measured using EZ-cytox solution after two days of drug treatment. Bars represent the means ± SD of three independent experiments, and * denotes p < 0.05 (Student’s t-test) versus the ctr_sh group. (E) Flow cytometry analysis of annexin V and propidium iodide (PI) staining following 5-FU (25 µM) or adriamycin (1 µM) treatment for three days in LSD1 knock-down cells. The percentage of apoptotic cells (annexin V-positive) is graphed. Bars represent the means ± SD of three independent experiments, and * denotes p < 0.05 (Student’s t-test) versus the ctr_sh group.

