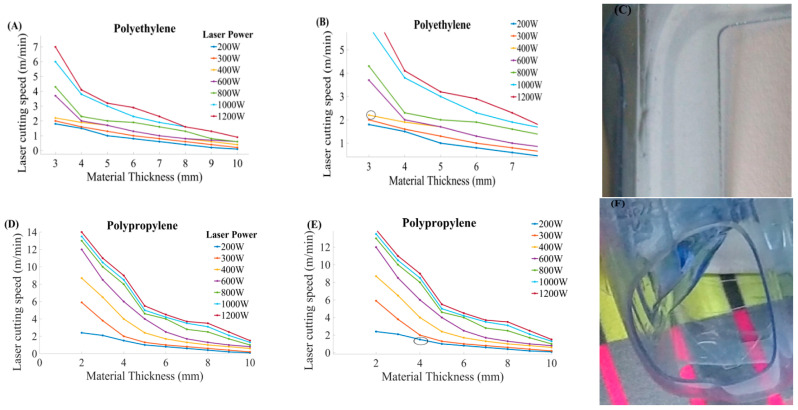
Figure 11.
Parametric trends for CS and the thickness at different power ratings for PE and PP (A): Graphical trends for CS and thickness for PE at different power, (B): Illustration of steep curve to describe the relationship between CS and thickness, (C): Pictorial representation of PE cut part, (D): Graphical trends for CS and thickness for PE at different power, (E): Illustration of steep curve to describe the relationship between CS and thickness, and (F): Pictorial representation of PP cut part [8].

