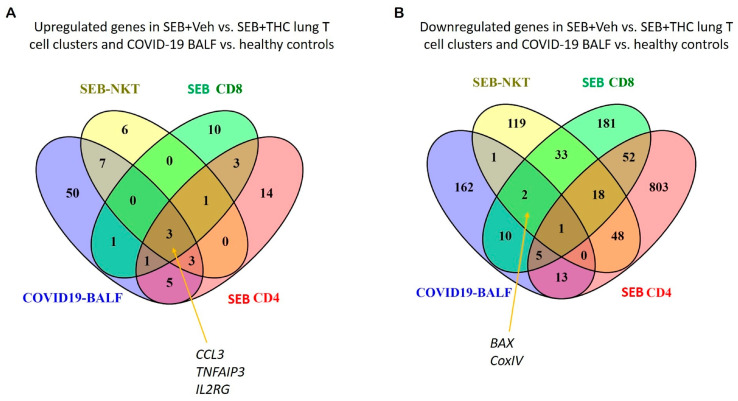
Figure 6.
Comparison of SEB-induced cytokines and apoptosis from ARDS mice and COVID19 patients. (A): Venn diagram was used in the display of up-regulated genes related to proinflammatory cytokines from SEB-induced ARDS mice and COVID19 BALF patients. (B): Venn diagram was used for displaying common down-regulated genes related to the apoptosis pathway from SEB-induced ARDS mice and COVID19 BALF patients.

