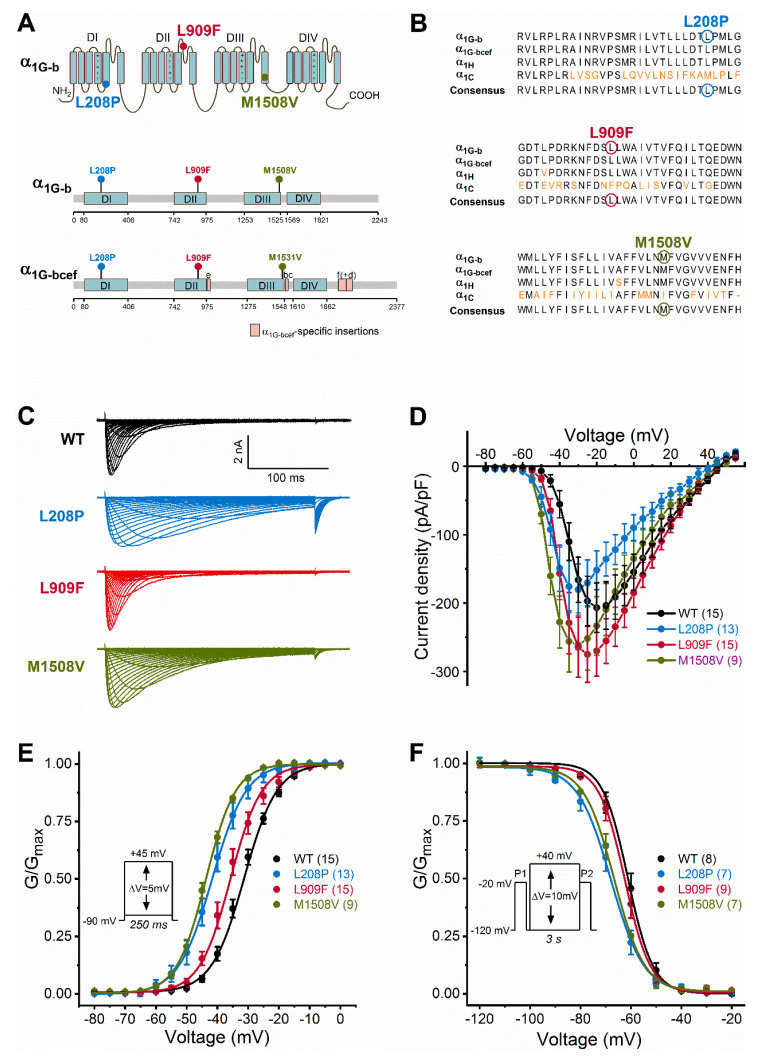
Figure 1.
Cav3.1 channel transmembrane topology, calcium channel homology, and voltage dependence of activation and inactivation of wild-type and mutant Cav3.1 channels. (A), Location of Cav3.1 channel mutations. The four membrane domains are labelled DI−DIV. The positive charges of segment 4 are shown in each domain. Note that all mutations fall in the pore region (segments 5 or 6). Lollipops representations of isoform b (α1G-b) and isoform bcef (α1G-bcef), showing the position of mutations. The M1508V mutation in α1G-b corresponds to the M1531V mutation in α1G-bcef [6]. Note the α1G-bcef-specific insertions in loop II-III (insertion e), loop III-IV (bc), and the C terminus (f and d) compared to α1G-b. (B), The L208P, L909F, and M1508V mutations affect highly conserved amino acid residues within the Cav3 channel family. Sequence alignments of the α1G-b, α1G-bcef, α1H (human Cav3.2 channel), and α1C (rabbit Cav1.1 channel) regions affected by the mutations. Cav1.1 was included in the analysis because of the known high-resolution structure of this channel [16]. The conserved sequence motifs nearby the mutations are shown; non-conserved residues are in orange; residues affected by mutations are marked by circles. (C), Representative whole-cell current traces are shown from top to bottom for the wild-type (WT), L208P, L909F, and M1508V variants. Current traces were elicited using the voltage protocol described in the material and methods and shown in E. (D), Current density–voltage relationships. Maximum inward current densities of individual Cav3.1 variants were not significantly changed compared to WT (one-way ANOVA followed by Dunnett’s post-hoc test; Table 1). (E), Voltage dependence of activation. Normalized conductance–voltage relationships of G/Gmax were obtained by nonlinear least-squares fits of data with Boltzmann equations (Equation (1)). The mean half-maximal activation voltages (V0.5,act) of L208P, L909F, and M1508V were significantly hyperpolarized compared to WT (in all cases p < 0.0001), whereas the slope factor (k) values were unchanged (one-way ANOVA followed by Dunnett’s post-hoc test; Table 1). (F), Voltage dependence of inactivation was assessed using the voltage protocol described in the material and methods and shown in the inset. Parameters of inactivation were obtained by fitting data with Boltzmann equations (Table 1). Relative to WT, the mean half-maximal inactivation voltages (V0.5,inact) of L208P and M1508V were significantly hyperpolarized (in both cases p < 0.0001), whereas that of L909F was unchanged; the k values of inactivation of all variants were not significantly different (one-way ANOVA followed by Dunnett’s post-hoc test; Table 1). For all variants, the shifts of the activation and inactivation curves resulted in an increased window current relative to WT, consistent with GoF. Data are mean ± SEM; n, the number of experiments in parentheses.

