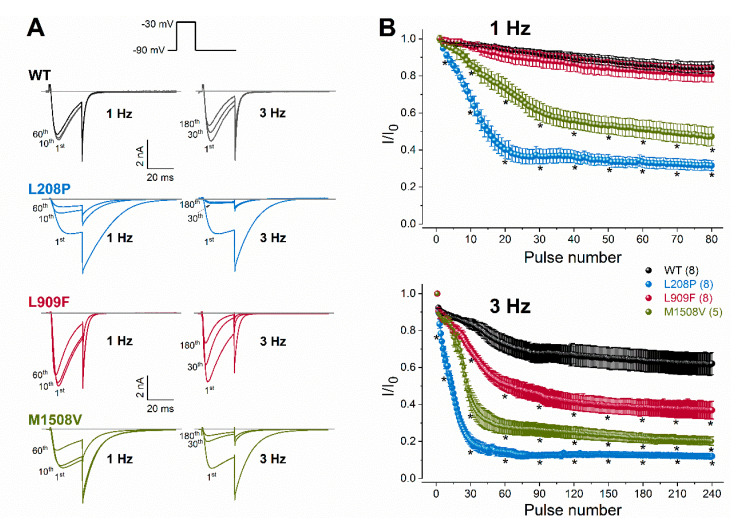
Figure 4.
Rate-dependent changes in calcium current availability of WT and mutant Cav3.1 channels. (A), Representative whole-cell currents recorded during the 1st, 10th, and 60th depolarization at 1 Hz, or during the 1st, 30th, and 180th depolarization at 3 Hz. Inset: voltage protocol. Horizontal grey lines indicate zero-current levels. (B), Plots of normalized WT and mutant peak calcium currents as a function of the stimulus number for the 1- (top) and 3-Hz (bottom) stimulus rates. Currents were normalized to the first stimulus. Data are mean ± SEM; the number of experiments, n, is shown in parentheses; Selected mean current amplitude values, elicited by pulse number 1, 3, 10, 20, 30, 40, 50, 60, 70, and 80 during 1-Hz stimulation and pulse number 1, 3, 10, 30, 60, 90, 120, 150, 210, and 240 during 3-Hz stimulation were included in the statistical analysis. The p values of the ‘Cav3.1 variant ∗ pulse number’ interaction associated with current availability at 1 or 3 Hz were < 0.0001. Asterisks indicate statistically significant differences compared to WT (p < 0.05 in two-way ANOVA followed by Dunnett’s post hoc test); see also Table 1.

