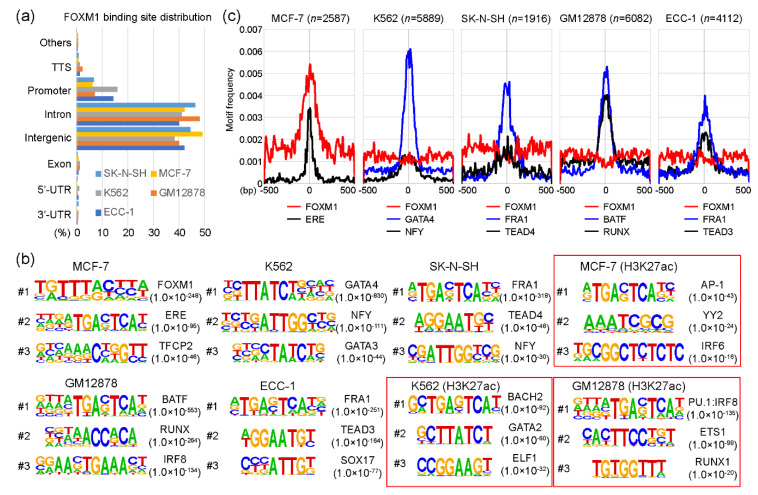
Figure 1.
FOXM1 (Forkhead box protein M1) binding motif analysis. (a) Distributions of FOXM1 binding sites in SK-N-SH, MCF-7, K562, GM12878, and ECC-1 cell lines are shown, according to transcription termination site (TTS), promoter (+/− 2kb of the transcription start site), intron, intergenic, exon, 5′-unstranslated region (5′-UTR), and 3′-UTR. (b) Top three motifs identified with FOXM1 binding sites in a given cell line are shown. H3K27ac-enriched regions were used as control sets for the motif analysis of MCF-7, K562, and GM12878 cell lines (red boxes). (c) Motif frequencies of the top two motifs in each cell line were plotted according to the center of FOXM1 binding peaks.

