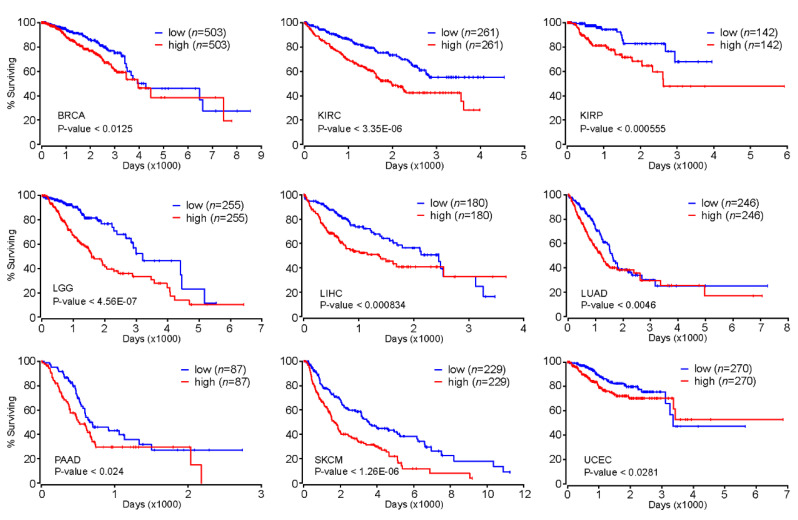
Figure 5.
Kaplan–Meier survival analysis based on the FOXM1 expression level. Kaplan–Meier (KM) survival analysis was conducted using Oncolnc (http://www.oncolnc.org/). Patients were divided into high (50%) or low (50%) groups based on the expression level of the FOXM1 gene.

