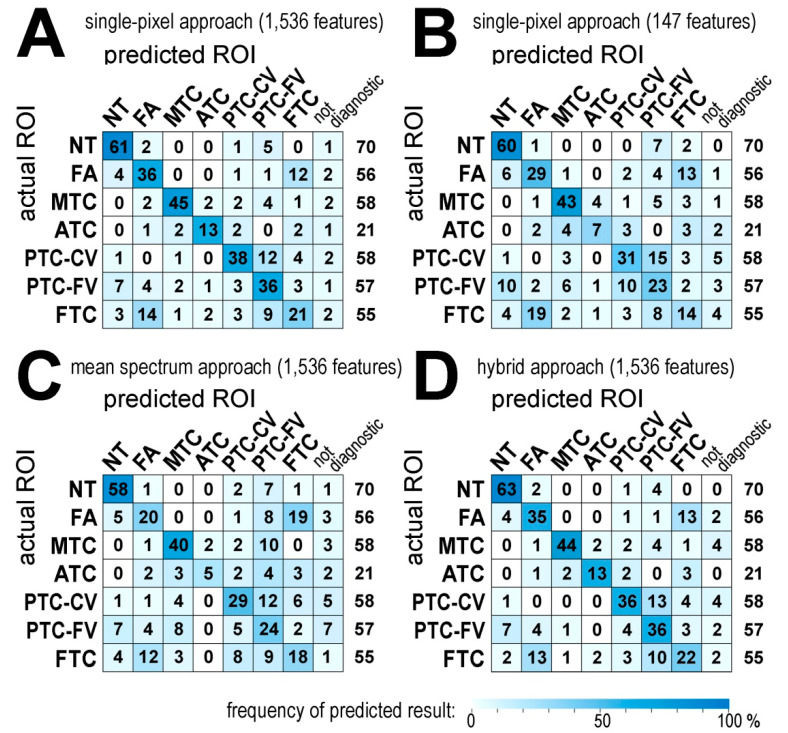
Figure 4.
Classification of normal and cancerous thyroid tissue cores based on MSI-registered spectra. Results of a core class prediction are presented as actual numbers (a relative frequency of specific results is color-coded according to the color scale); the last column represents the total number of cores. Presented are: a single-pixel approach for 1536 features (panel A) and 147 features (panel B), a mean spectrum approach for 1536 features (panel C), and a hybrid approach for 1,536 features (panel D).

