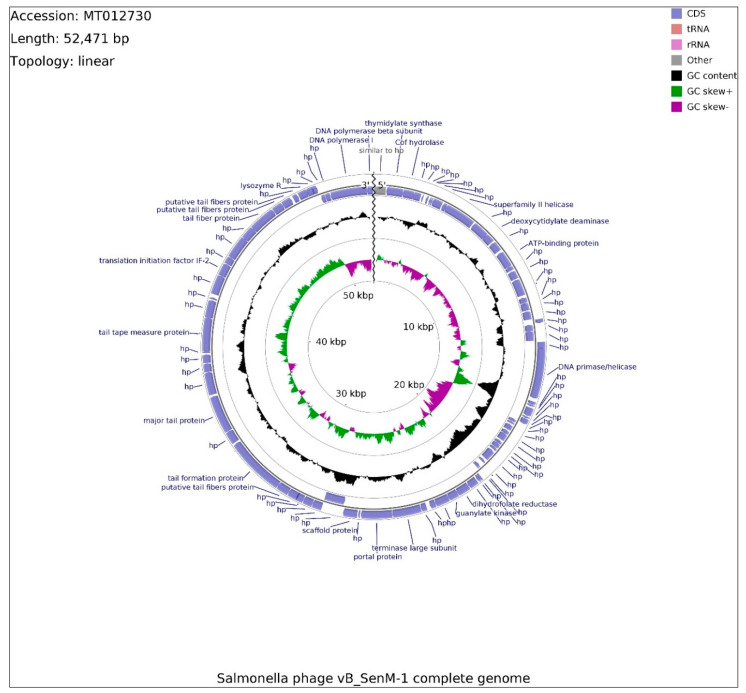
Figure 6.
Schematic linear map of phage vB_SenM-1 genome (ends of the genome are indicated by the wavy line). The inner rings show genome location, GC skew + (green) and — (purple) and GC content (black). Two the most external rings show identified open reading frames (blue arrows) and results of genome annotation process.

