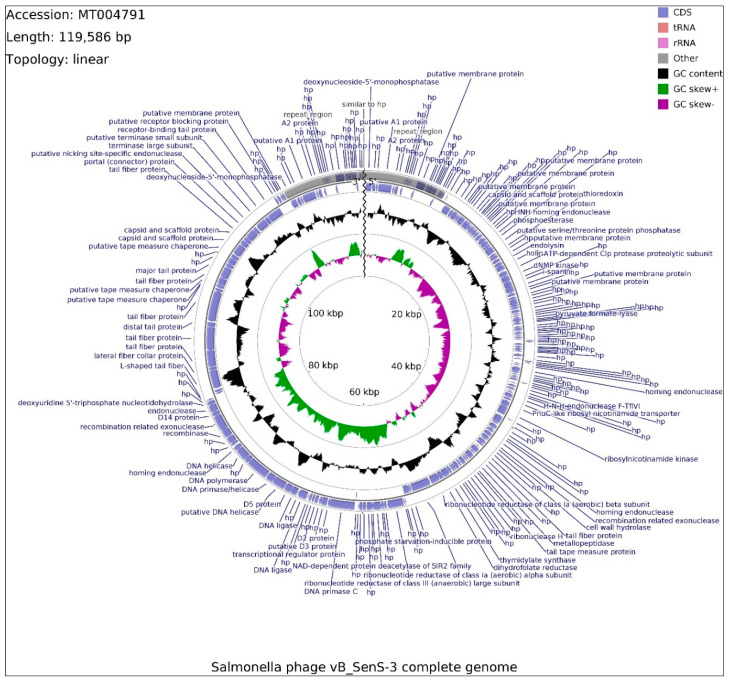
Figure 7.
Schematic linear map of genome of the vB_SenS-3 phage (ends of the genome are indicated by the wavy line). The inner rings show genome location, GC skew + (green) and—(purple) and GC content (black). The two most external rings show identified open reading frames (blue arrows) and results of genome annotation process. Repeated sequence at the beginning and the end of phage genome is marked in gray.

