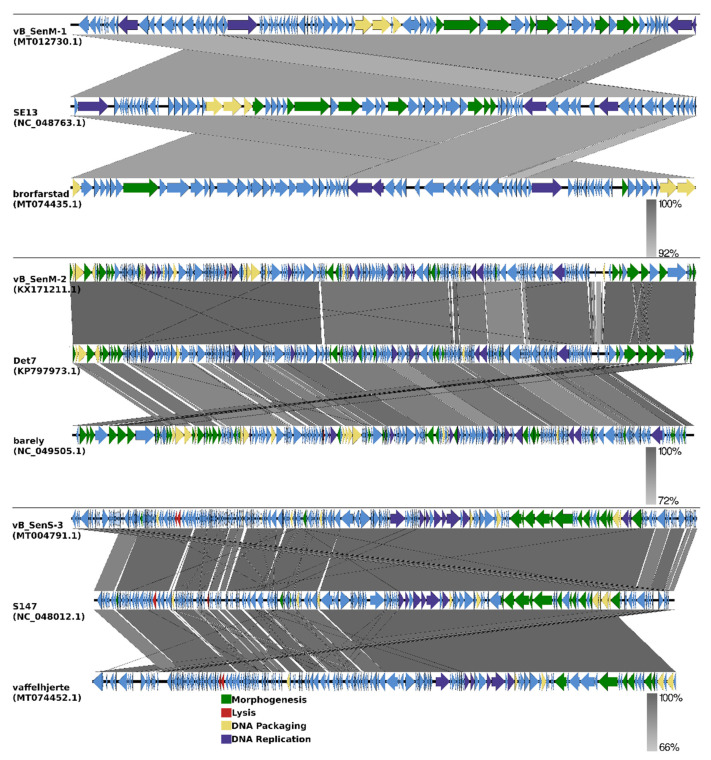
Figure 8.
EasyFig output image of the genomic comparison between phages vB_SenM-1, vB_SenM-2, and vB_SenS-3 and the most closely related phages. Phage genomes are presented by linear visualization, with coding regions shown as arrows. Selected open reading frames are colored in relation to their functions. The percentage of sequence similarity is indicated by the intensity of the gray color.

