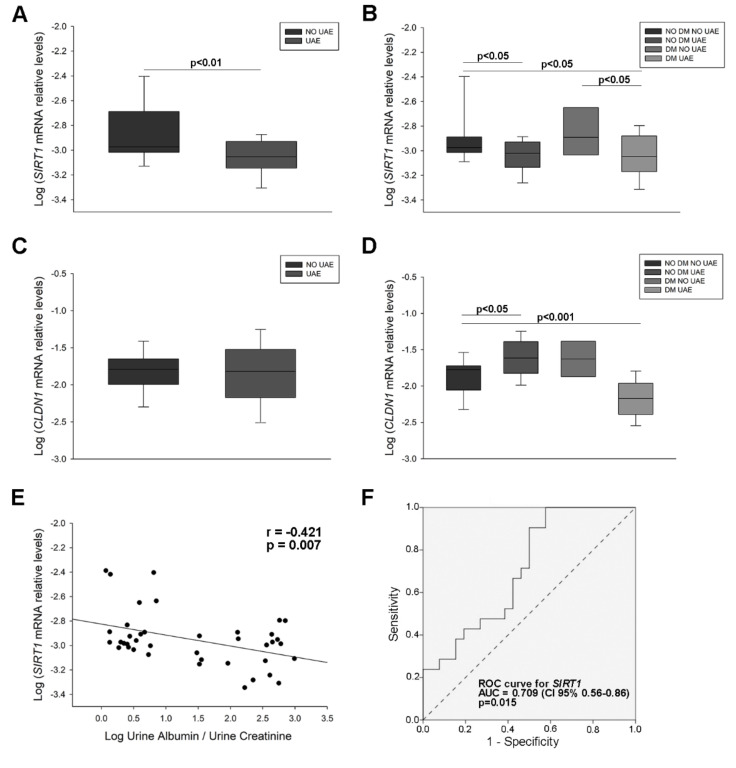
Figure 1.
Sirtuin 1 (SIRT1) and Claudin 1 (CLDN1) mRNA levels in urinary sediment of hypertensive patients. (A) Box plot of the comparison of SIRT1 mRNA levels between patients with increased UAE and normal UAE levels; (B) Box plot comparing SIRT1 mRNA levels in patients with hypertension and normal UAE (NO DM NO UAE) with non-diabetic patients with increased UAE (NO DM UAE), diabetic patients with normal UAE (DM NO UAE) and diabetic patients with elevated UAE (DM UAE); (C) Box plot of the comparison of CLDN1 mRNA levels between 2 groups (above described); (D) Box plot comparing CLDN1 mRNA levels between patients divided in 4 groups (above described); (E) Scatter plot of the correlation between SIRT1 mRNA levels and UAE values; (F) ROC curve analysis of SIRT1 mRNA to test its predictive value for UAE discrimination. Horizontal bars represent median ± standard error of the mean (SEM). mRNA levels were normalised to two housekeeping genes and log relative expression was expressed: a gene is up-regulated when its relative values are higher in the disease group than those in controls. If the values are lower, the gene is down-regulated. The AUC and 95% CI are plotted in the graph. SIRT1: Sirtuin 1 gene; CLDN1: Claudin 1 gene; UAE: urinary albumin excretion; DM: diabetes mellitus; ROC: receiver operating characteristic; AUC: area under the curve; CI: confidence interval.

