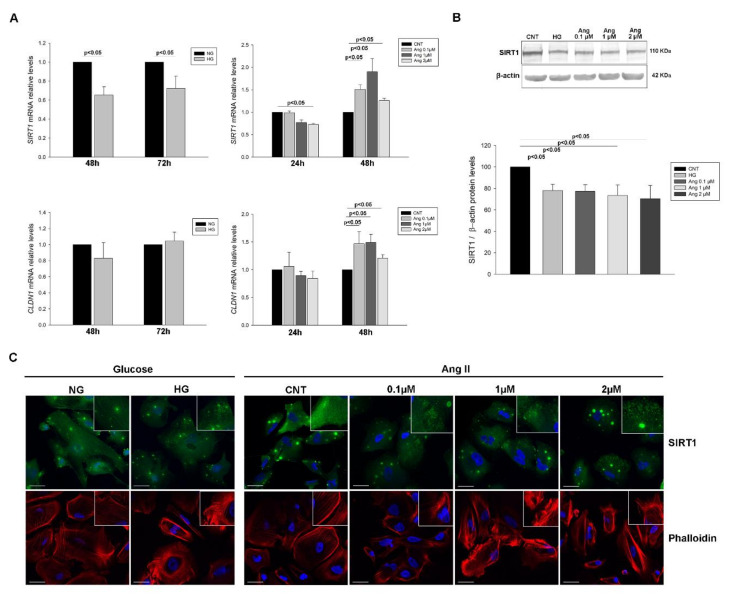
Figure 2.
SIRT1 and CLDN1 levels in podocyte cultures subjected to HG and Ang II treatments. (A) Bar graphs of the comparison of SIRT1 and CLDN1 mRNA levels between NG and HG and between Ang increasing concentrations at different treatment times; (B) Blots of SIRT1 protein levels in glucose and Ang II treated podocytes; (C) Immunofluorescence analyses of SIRT1 in treated podocytes and phalloidin staining of F-actin fibers showing the cytoskeleton dysregulation under treatments. Bars represent mean ± SEM (n = 6 each group). mRNA levels were normalised to two housekeeping genes and relative expression was expressed in fold change with CNT group values set to 1-fold. Protein levels were previously normalised to β-actin and expressed as arbitrary units, with CNT values set to 100. SIRT1: Sirtuin 1 gene; CLDN1: Claudin 1 gene; NG: normal glucose; HG: high glucose; CNT: control; Ang: angiotensin II. Scale bar: 40 µm.

