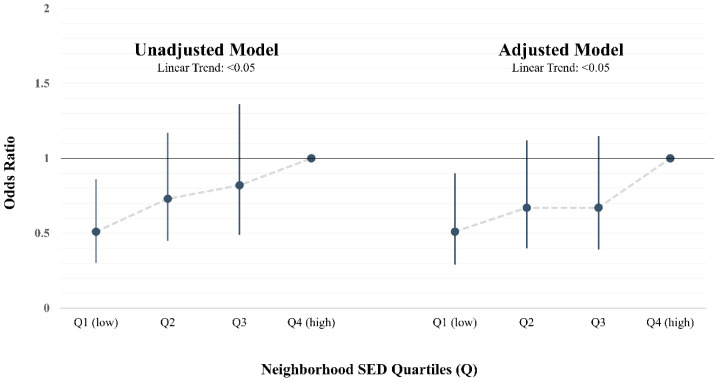
Figure 2.
Unadjusted and adjusted odds of overweight/obesity by neighborhood socioeconomic deprivation (SED) quartiles. Unadjusted model accounted for participants clustered within schools. Adjusted model controlled for age, sex, race/ethnicity, parent education, MVPA minutes per hour, sedentary minutes per hour, and diet quality; and accounted for participants clustered within schools. Neighborhood SED expressed as quartiles (Q), with low SED or more affluent neighborhood in the first quartile (Q1, low) and high SED or more deprived neighborhood in the fourth quartile (Q4, high). Quartile 4 (Q4, high) serves as the reference group. Odds ratios depicted as dot, 95% confidence intervals depicted by vertical line, and linear trend in odds ratio across neighborhood SED quartiles depicted by dashed line.

