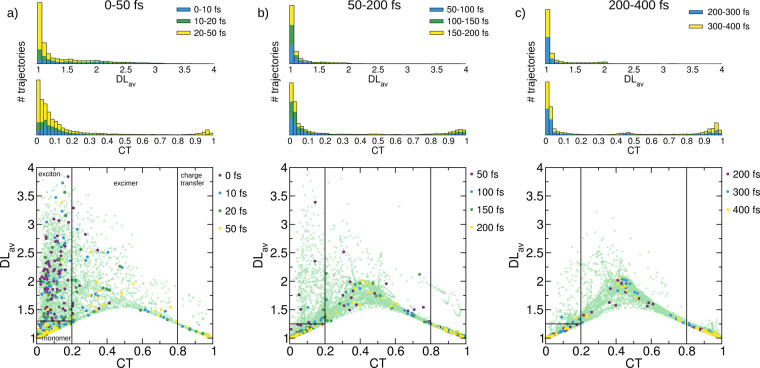
Figure 3.
Time evolution of CT and DLav descriptors during the dynamics. Light-green crosses indicate all trajectories in the full specified time interval, and solid colored circles depict the trajectories at the given simulation time. The black lines indicate the areas defined as the exciton, monomer-like, excimer, and charge-transfer states, as detailed in the main text. The histograms on the top indicate the CT and DLav contributions in the specified time interval and are separated by color in the respective intervals.

