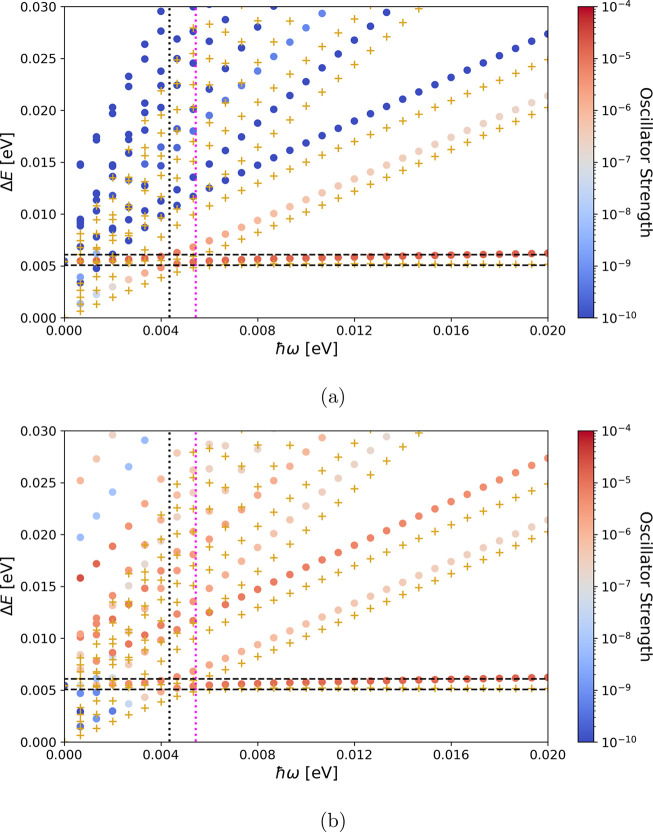
Figure 3.
(a and b) Rabi dispersion relation for HD+ in a cavity for COM motion Ekin = 0 and Ekin = 0.24 × 10⁻² eV, respectively. The bright polaritonic states at the dressed L0–L1 transition (vertical black line) are indicated by the two horizontal lines. The magenta vertical line shows the prediction of the JC model, which does not account for the net-charge frequency dressing. Dark (blue) and bright (red) states can be identified by corresponding dipole oscillator strengths. The yellow crosses (+) indicate energies derived from the JC model.

