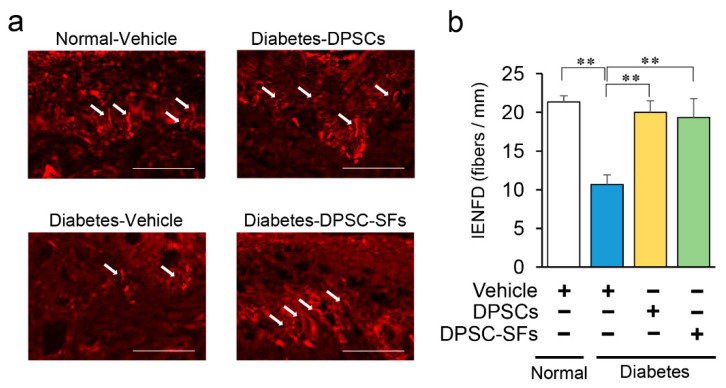
Figure 4.
Effects of DPSC transplantation and DPSC-SF administration on the intraepidermal nerve fiber densities (IENFDs). (a) Representative images of intraepidermal nerve fiber profiles. Nerve fibers were visualized by staining with anti-PGP9.5 antibody. White arrows demonstrated unmyelinated small fibers in epidermis. Bar = 50 µm. (b) IENFD was counted under a confocal system (n = 5). Results are presented as the mean ± SEM, ** p < 0.01.

