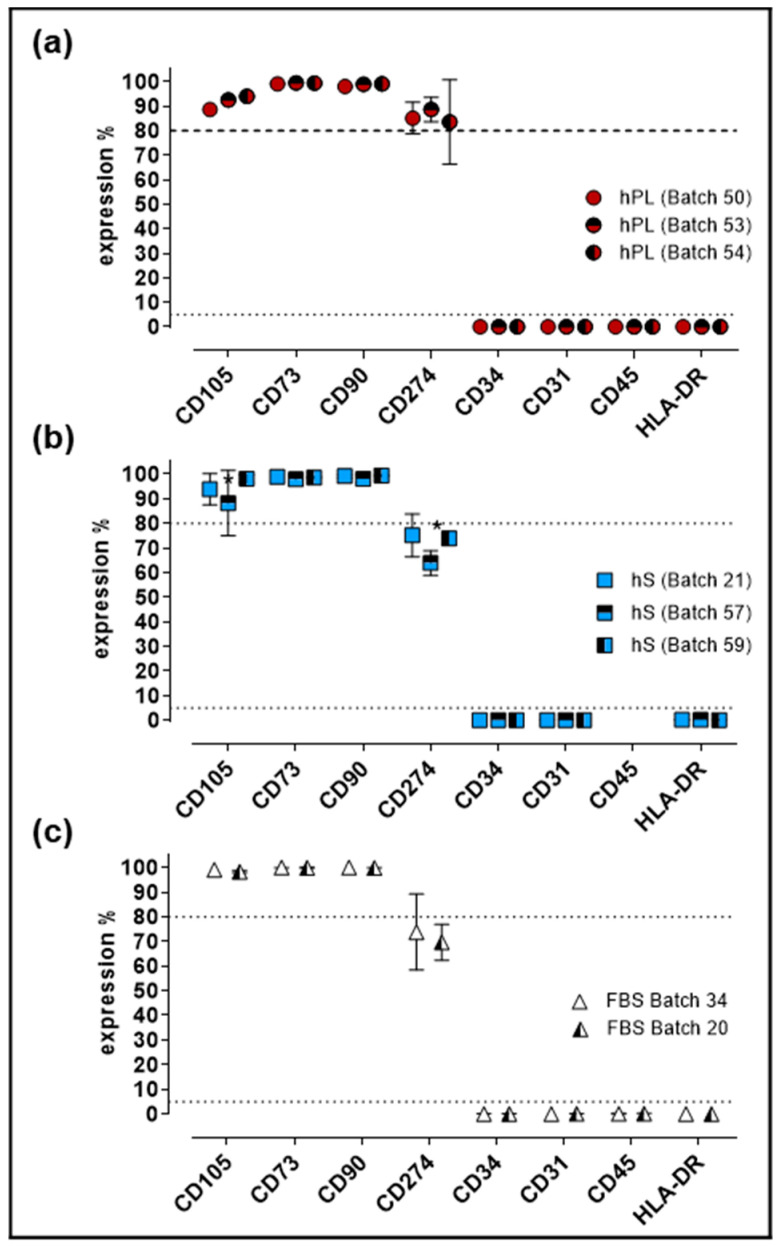
Figure 5.
Immunophenotypic profile of WJ-MSC expanded with hPL, hS and FBS. (a) Percentage of expression of MSC markers present in WJ-MSC expanded with different batches of hPL (n = 3 batches); (b) hS (n = 3 batches) and (c) FBS (n = 2 batches); Data is shown as mean ± SD, * p < 0.05 analyze by Tukey’s test.

