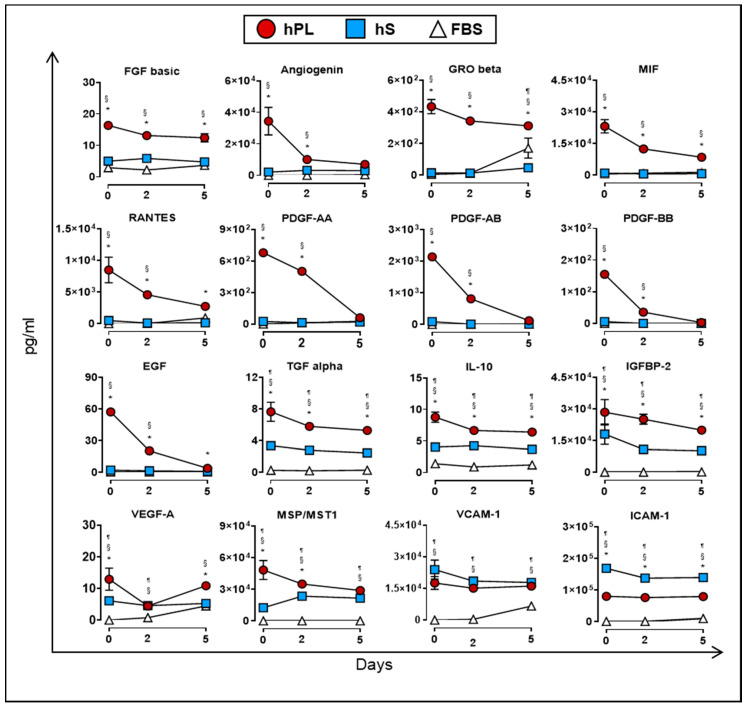
Figure 7.
Uptake of cytokines and growth factors measured in supernatants from WJ-MSC cultured in hPL (n = 4), hS (n = 3) and FBS (n = 1) at days 0, 2 and 5 (n = 3 donors). Data are represented as mean of concentration ±SD. § p < 0.05 FBS vs. hS, ¶ p < 0.05 FBS vs. hLP, * p < 0.05 hLP vs. hS, as analyzed by Tukey’s test.

