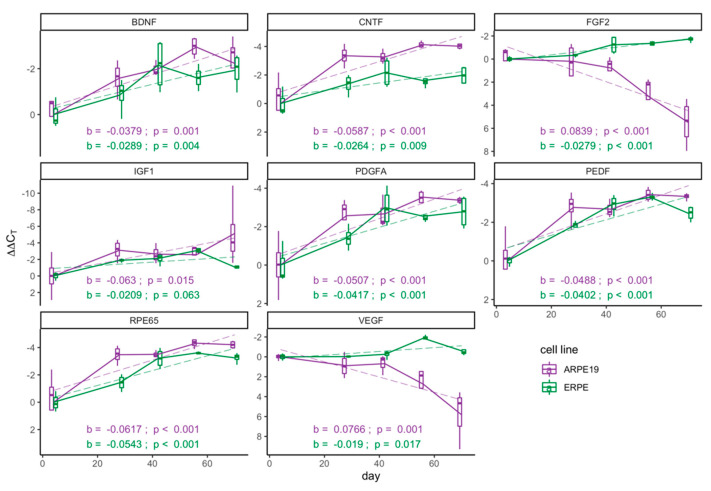
Figure 2.
Key functional genes progressively increase with maturation. Real-time polymerase chain reaction (RT-qPCR) analysis of mRNA levels across 70 days of culture in E-RPE culture (green) and ARPE-19 culture (purple). Results were normalized to an endogenous reference gene (PPIA) and are presented as ΔΔCt means (n = 4) ± standard deviation at each time point. A linear regression model (dashed line) was used to describe the relationship between ΔΔCt values and days of maturation of each gene for both RPE cell sources; regression coefficients, denoted as b, and associated p-values, to reject the null hypothesis that b = 0, are shown on each graph.

