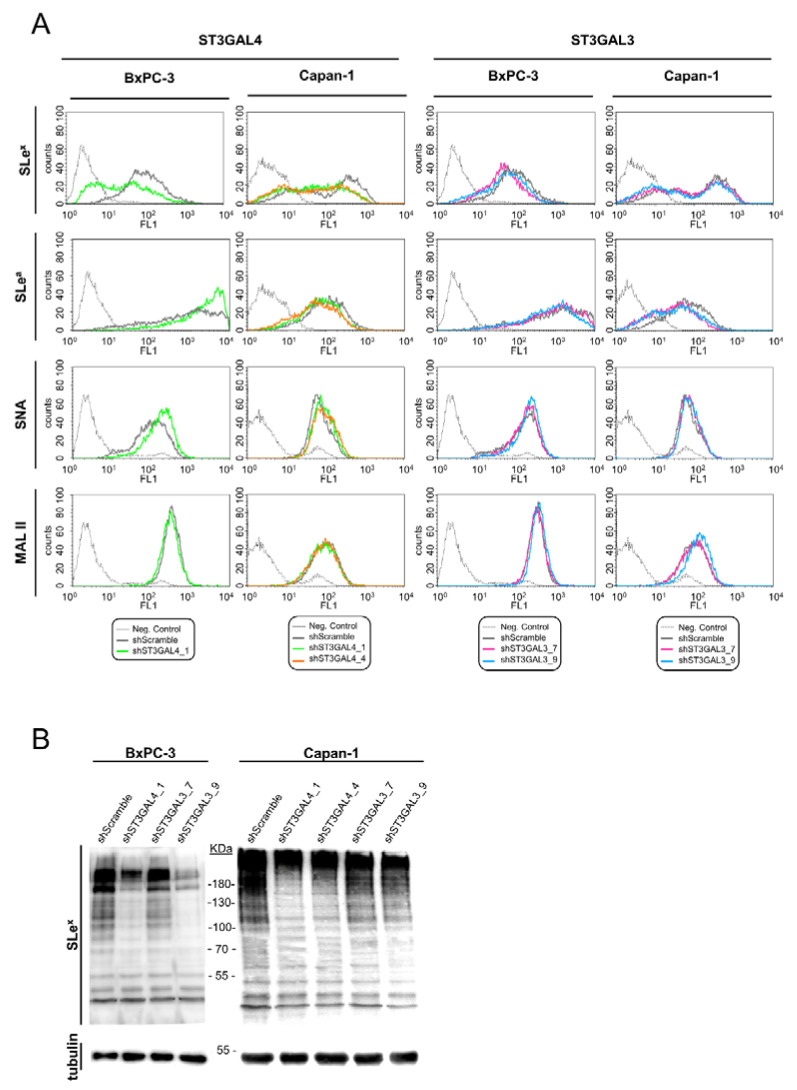
Figure 5.
Glycan analysis of ST3GAL3 and ST3GAL4 knockdown BxPC-3 and Capan-1 cells. (A) Representative flow cytometry profiles of the cell surface glycans structures detected with sLex and sLea antibodies and the lectins SNA and MAL II in knockdown ST3GAL4 cells (left) and ST3GAL3 cells (right) using different shRNA sequences. Negative controls (without the primary antibodies or lectins) are represented using a continuous black dot line: (…), shScramble (black line), shST3GAL4_1 (green line), shST3GAL4_4 (orange line), shST3GAL3_7 (pink line) and shST3GAL3_9 (blue line). (B) Immunodetection by WB showing the reduction of sLex antigens in selected cell lysates from total protein on BxPC-3 (top left) and Capan-1 cells (top right) with anti-sLex antibody (clone CSLEX1). Anti-tubulin WB of the corresponding membrane is showed on the bottom panel.

