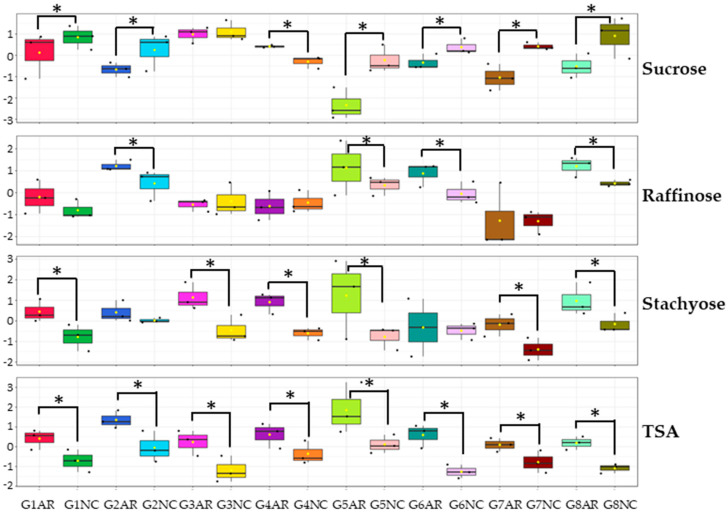
Figure 4.
Main soluble sugar and total sugar alcohol content in the eight soybean genotypes (G1 to G8) cultivated in two different locations (Arkansas, AR, and North Carolina, NC). The content levels in mg were log-transformed and auto-scaled using MetaboAnalyst software for better visualization. The comparison was done across locations for each genotype. Significant differences are noted with asterisks (ANOVA, Fisher LSD, p < 0.05, n = 3).

