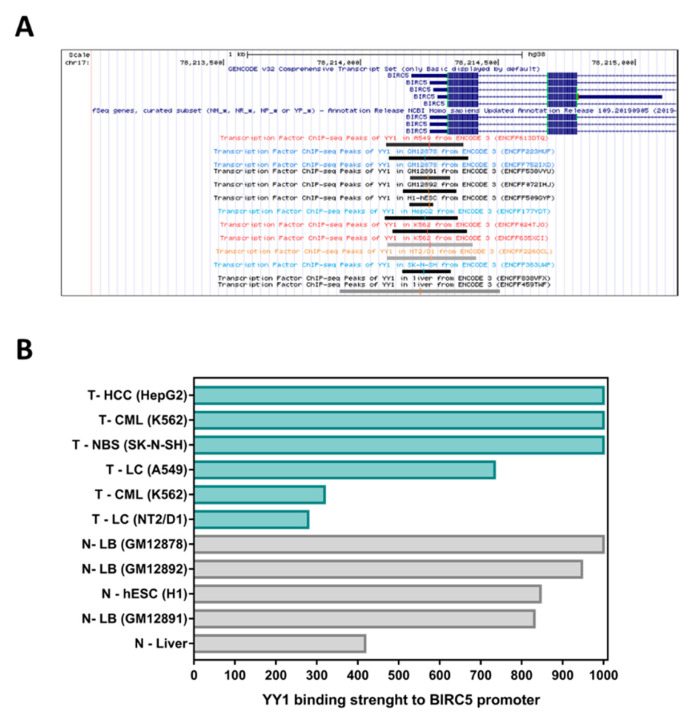
Figure 1.
YY1 Transcription Factor ChIP-seq binding-peaks within BIRC5 promoter, according to public results available in ENCODE. (A). Black and grey boxes identify peaks of YY1 occupancy within the BIRC5 promoter (from −2000 to +1000 bp around the TSS). The length of each box indicates the region of binding within the promoter, while the gray-scale of the boxes is proportional to the strength of the binding of YY1 transcription factor to BIRC5 promoter. (B). Bar plot summarizing the binding strength of YY1 binding to BIRC5 promoter found in each positive experiment (signal strength score ranges from 0 to 1000). T = tumor samples (green); N = normal samples (grey).

