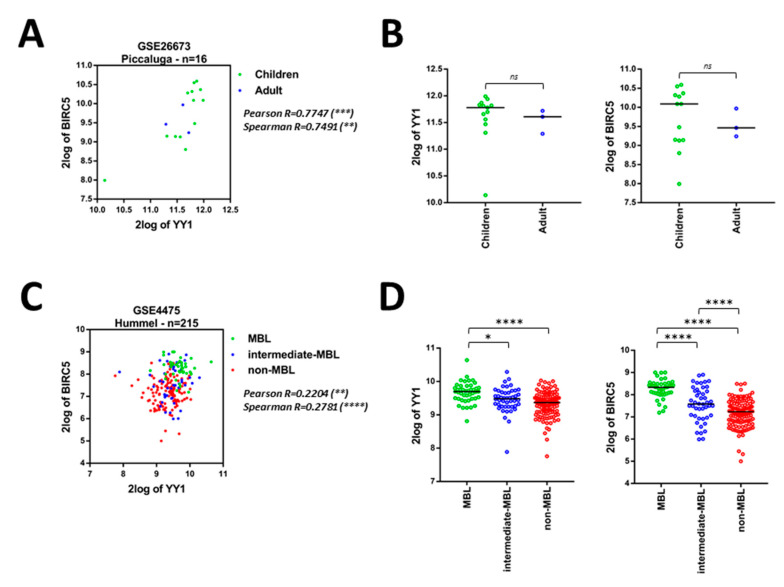
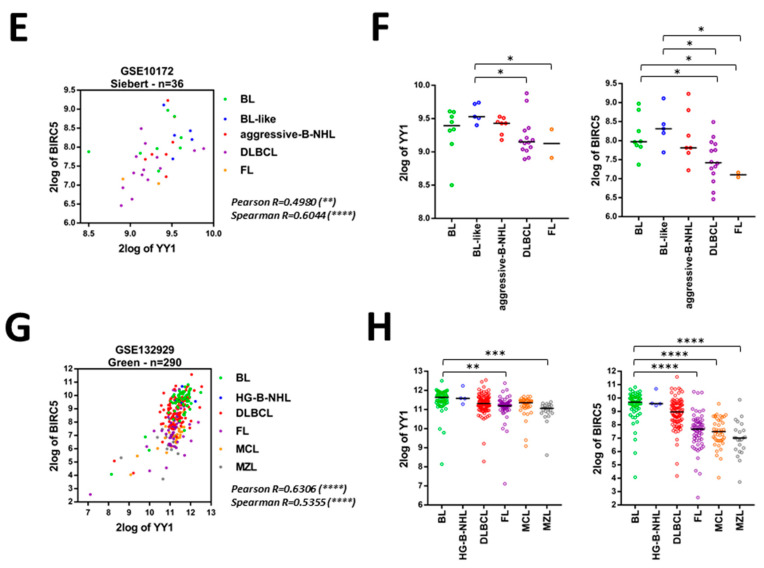
Figure 3.
Correlation between YY1 and BIRC5 expression and relative YY1 and BIRC5 expression levels in different B-NHL subgroups, within 4 different B-NHL GEO Datasets. (A). GSE26673, Burkitt’s Lymphoma (BL), Pearson and Spearman correlation between YY1 and BIRC5 expression, patients stratified according to age (children, green; adult, blue). (B). GSE26673, dot plots of YY1 (left) and BIRC5 (right) expression with patients stratified by age (children, green; adult, blue). (C). GSE4475, B-NHL patients stratified based on molecular BL features (MBL green, intermediate-MBL blue, non-MBL red), Pearson and Spearman correlation between YY1 and BIRC5 expression. (D). GSE4475, dot plots of YY1 (left) and BIRC5 (right) expression with patients stratified based on molecular BL features (MBL green, intermediate-MBL blue, non-MBL red). (E). GSE10172, B-NHL patients stratified based on cancer type (BL green, BL-like blue, aggressive-B-NHL red, DLBCL purple, FL orange), Pearson and Spearman correlation between YY1 and BIRC5 expression. (F). GSE10172, dot plots of YY1 (left) and BIRC5 (right) expression with patients based on cancer type (BL green, BL-like blue, aggressive-B-NHL red, DLBCL purple, FL orange). (G). GSE132929, B-NHL patients stratified based on cancer type (BL green, HG-B-NHL blue, DLBCL red, FL purple, MCL orange, MZL grey), Pearson and Spearman correlation between YY1 and BIRC5 expression. (H). GSE132929, dot plots of YY1 (left) and BIRC5 (right) expression with patients based on cancer type (BL green, HG-B-NHL blue, DLBCL red, FL purple, MCL orange, MZL grey). Data in B, D, F, H are presented as dotted plots with Median ± SD. Significance was evaluated using one-way ANOVA with Tukey’s post-hoc comparison test (* p < 0.05; ** p < 0.01; *** p < 0.001; **** p < 0.0001; ns, not significant).


