Figure 5.
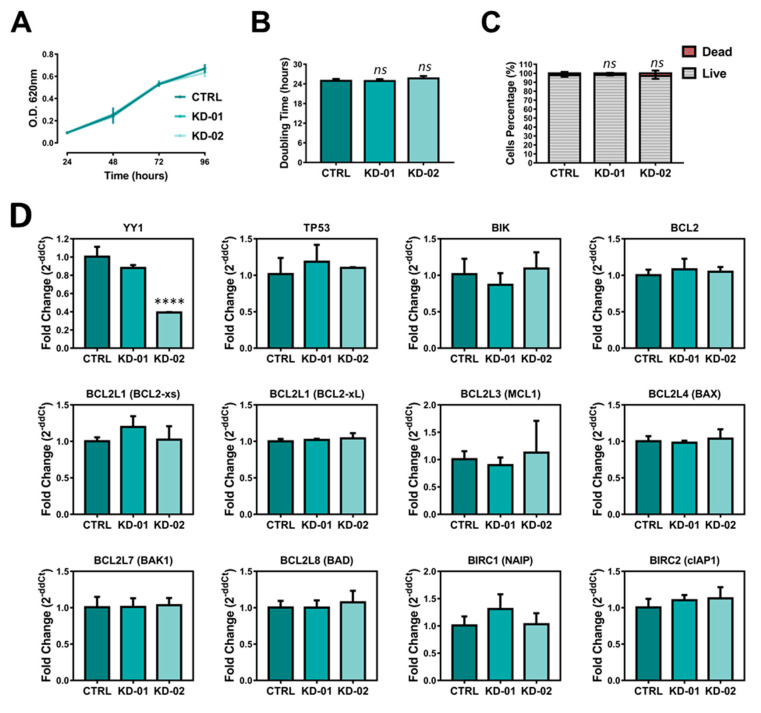
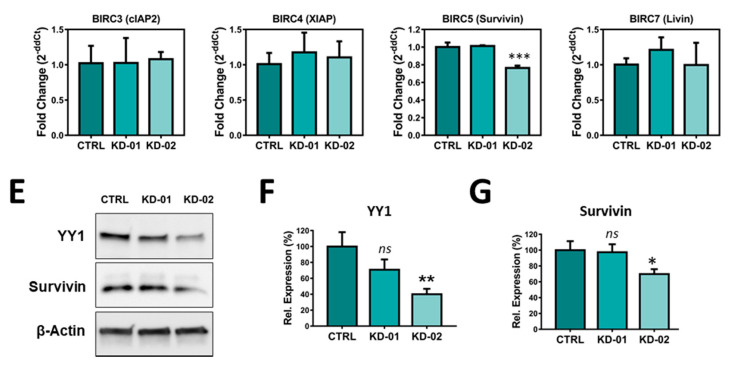
(A). MTT-based growth curve of the CTRL, KD-01 and KD-02 Raji cells (OD at 620 nm in function of the days in culture). (B). Doubling times of the CTRL, KD-01 and KD-02 Raji cells. (C). Viable vs. dead count of Raji CTRL, KD-01 and KD-02, after 96 h in culture (Trypan Blue exclusion method). (D). Quantitative-RT-PCR study of YY1 expression and potential transcriptional YY1-target genes in CTRL, KD-01 and KD-02 Raji cells. Each Ct is normalized for the relative Ct of GAPDH (housekeeping control) and then plotted values are expressed as fold change, 2−ddCt, compared to CTRL. (E). Western blot of CTRL, KD-01 and KD-02 Raji cells for YY1 (60 KDa), survivin (17 KDa), and β-Actin (42 KDa, normalization control). (F). Western blot densitometry analysis for YY1. (G). Western blot densitometry analysis for survivin. For each sample, the protein signal is normalized to the relative β-Actin signal, and then each value is expressed as percentage compared to CTRL, considered 100%. The results in A, B, C, D, F, G are presented as Mean ± SD; one-way ANOVA with Tukey’s post-hoc test have been performed (* p < 0.05; ** p < 0.001; *** p < 0.001; **** p < 0.0001; ns, not significant).


