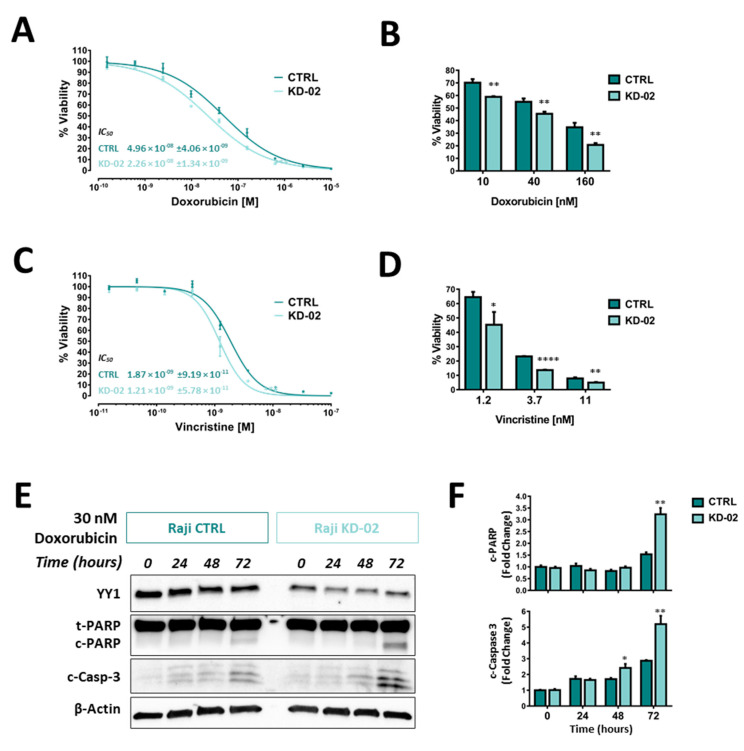
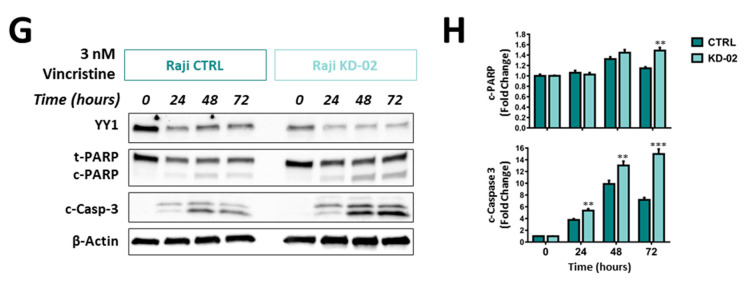
Figure 6.
(A). Doxorubicin concentration-response treatment in Raji CTRL and KD-02 (knock-down for YY1). (B). Viability of Raji CTRL and KD-02 at Doxorubicin 10, 40 and 160 nM (doses around the CTRL and KD-02 IC50s). (C). Vincristine concentration-response treatment in Raji CTRL and KD-02. (D). Viability of Raji CTRL and KD-02 at vincristine 1.2, 3.7 and 11 nM (doses around the CTRL and KD-02 IC50s). (E). Western blot analysis of Raji cells non-silenced (CTRL) and silenced for YY1 (KD-02), treated with 30 nM doxorubicin, from 0 to 72 h. The signals are detected for YY1 protein (band at 60 KDa), total PARP (t-PARP) and cleaved PARP (c-PARP) proteins (bands respectively at 89 and 116 KDa), cleaved Caspase 3 (c-Casp-3) protein (two bands at 17 and 19 KDa) and β-Actin protein (used as normalization control, band at 42 KDa). (F). Densitometry analysis for c-PARP and c-Casp-3 from the immunoblot reported in A; the data are expressed as fold change of the normalized signals, referred to the 0 h CTRL value. (G). Western blot analysis of Raji cells non-silenced (CTRL) and silenced for YY1 (KD-02), treated with 3 nM vincristine, from 0 to 72 h. The signals are detected for YY1, t-PARP and c-PARP, c-Casp-3 and β-Actin proteins. (H). Densitometry analysis for c-PARP and c-Casp-3 from the immunoblot reported in C, data expressed as fold change of the normalized signals, referred to the 0 h CTRL value. The results are presented as Mean ± SD, In A and C, the comparison between IC50s obtained in CTRL vs. KD-02 cells was performed using the two-tailed unpaired t-test (*** p < 0.001); in B, D, F, H the comparison between values obtained in CTRL vs. KD-02 cells was performed using the two-tailed unpaired t-test with Holm-Sidak correction for multiple comparisons (* p < 0.05; ** p < 0.01; *** p < 0.001; **** p < 0.0001).


