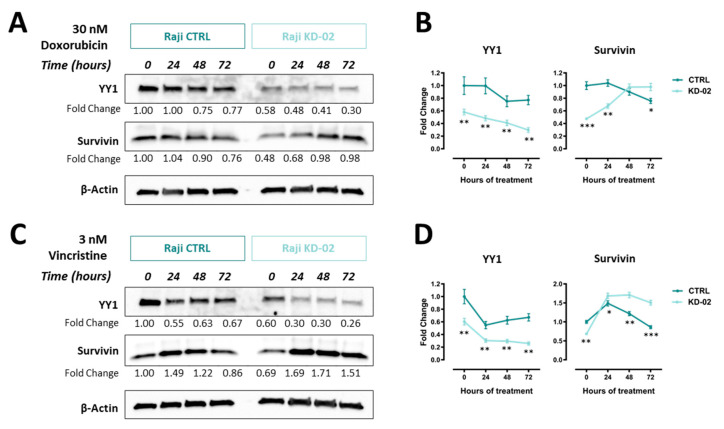
Figure 7.
(A). Western blot analysis of Raji cells non-silenced (CTRL) and silenced for YY1 (KD-02), treated with 30 nM doxorubicin, from 0 to 72 h. Signal detected for YY1 protein (band at 60 KDa), survivin (band at 17 KDa) and β-actin protein (used as normalization control, band at 42KDa). (B). Densitometry analysis for YY1 and survivin from the immunoblot reported in A, data expressed as fold change of the normalized signals, referred to the 0 h CTRL value. (C). Western blot analysis of Raji cells non-silenced (CTRL) and silenced for YY1 (KD-02), treated with 3 nM vincristine, from 0 to 72 h. Signals detected for YY1, survivin and β-actin proteins. (D). Densitometry analysis for YY1 and survivin from the immunoblot reported in C, data expressed as fold change of the normalized signals, referred to the 0 h CTRL value. The results reported in B and D are presented as Mean ± SD and the comparison between the values obtained in CTRL vs. KD-02 protein samples was performed using the two-tailed unpaired t-test with Holm-Sidak correction for multiple comparisons (* p < 0.05; ** p < 0.01; *** p < 0.001).

