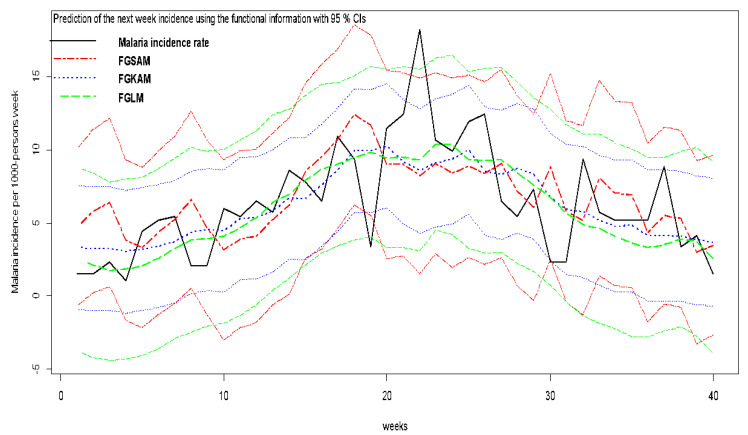
Figure 5.
Prediction of the raw rates (cases per 1000/pop) in the village of Dangassa i. i The predictions have been made in the validation period for the Functional Generalized Spectral Additive Model (FGSAM), the Functional Generalized Linear Model (FGLM), and the Functional Generalized Kernel Additive Model (FGKAM). We used functional information based on past incidence and meteorological covariates with 95% Confidence Intervals (CIs). The black solid line represents the validation set (40-week)-based incidence (observed). The two dashed red lines represent the FGSAM predictions and its 95% CI. The dotted blue lines represent the FKAM predictions and its 95% CI. The green long dash lines represent the FGLM predictions and its 95% CI. All 3 models performed well, but FGLM has 95% CI curves closer to the validation set incidence curves. FGLM seems to have the best tuned 95% CI prediction bandwidth.

