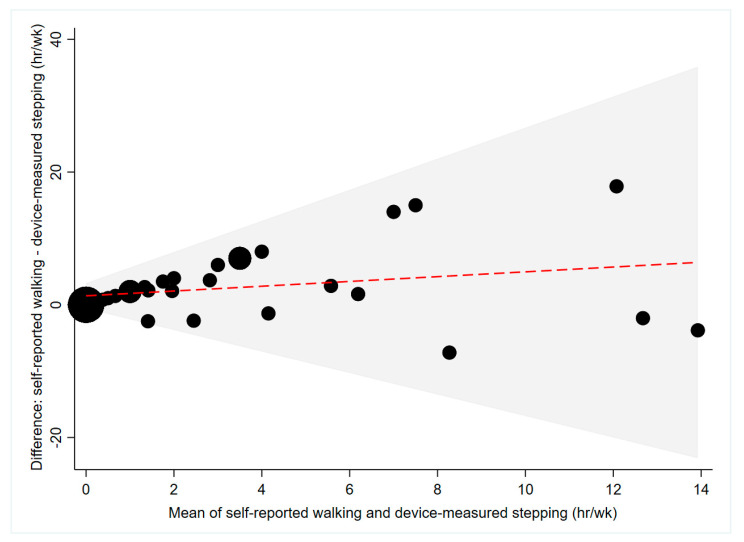
Figure 2.
Agreement between self-reported and device-measured walking/stepping time (n = 40). The red line represents the mean difference, the grey shaded area represents the limits of agreement and the size of the black dots differs depending on the number of participants that correspond to that value.

