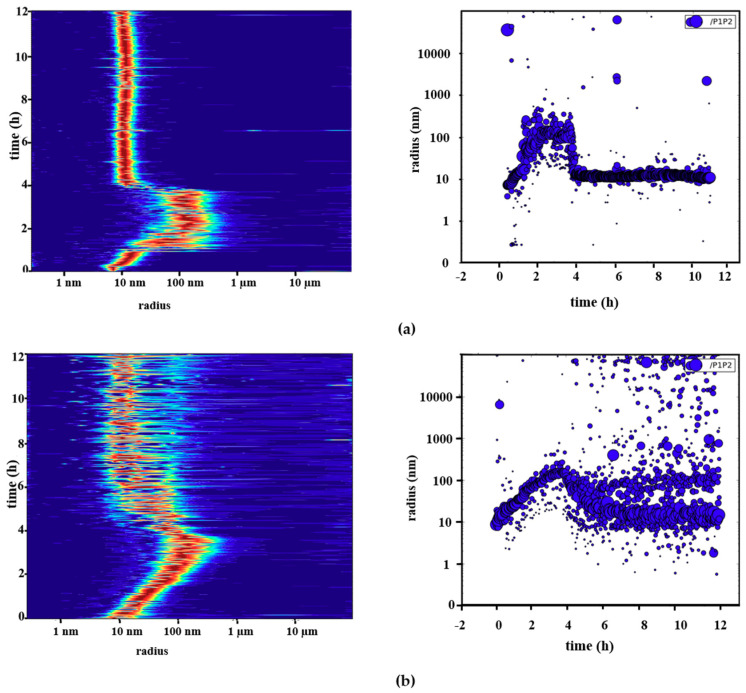
Figure 2.
Figures on the left in red indicate the particle size distribution, with the y-axis corresponding to the time course of the experiment and the horizontal axis showing the radius distribution. For figures on the right side, the axes are inverse. (a) Particle size distribution of dodecameric Pdx1 mixed with monomeric Pdx2 measured over 12 h after applying DLS. First, dodecameric Pdx1 was measured for 25 min after a solution of Pdx2 was added. After mixing Pdx1 and Pdx2, the predominant particle radii distribution shifted toward larger radii of approximately 100–300 nm. The high-molecular-weight particles (RH > 100 nm) remained for two to three hours. Subsequently, the particle radii shifted to approximately 10–14 nm, corresponding to the radius of the Pdx complex; (b) DLS measurements of a suspension containing dodecameric Pdx1 and oligomeric Pdx2 recorded over time. After 15 initial measurements of dodecameric Pdx1, oligomeric Pdx2 was added and the radius profile shifted toward higher radius values, i.e., oligomeric Pdx2 interacted with Pdx1 to form the Pdx complex. After 4–5 h, the equilibrium shifted toward a radius corresponding to the Pdx complex radius with some remaining polydispersity. As seen from the radius profile, some large oligomeric particles, presumably corresponding to Pdx2 oligomers, remained in solution.

