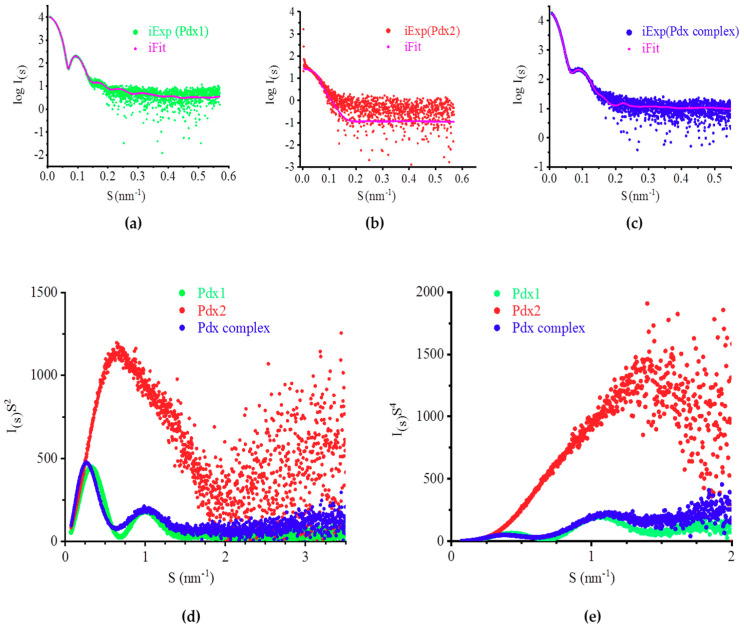
Figure 3.
Processed solution scattering intensity pattern of (a) Pdx1 (green), (b) Pdx2 (red), and (c) the Pdx complex (blue) in arbitrary intensity units. Their fits with selected homolog structures are shown in magenta (Pdx1: PDB ID 4ADU; Pdx2: PDB ID 2ABW; Pdx complex: PDB ID 4ADS). Data were processed and evaluated by applying the programs CRYSOL and SASREF; (d) dimensionless Kratky plots indicate globular and compact structures for Pdx1 and the Pdx complex and a more flexible structure for Pdx2 (Pdx1 is shown in green, Pdx2 in red, and the Pdx1–Pdx2 complex in blue); (e) Porod–Debye plots of the X-ray solution scattering (SAXS) data including the color-coding used in (d).

