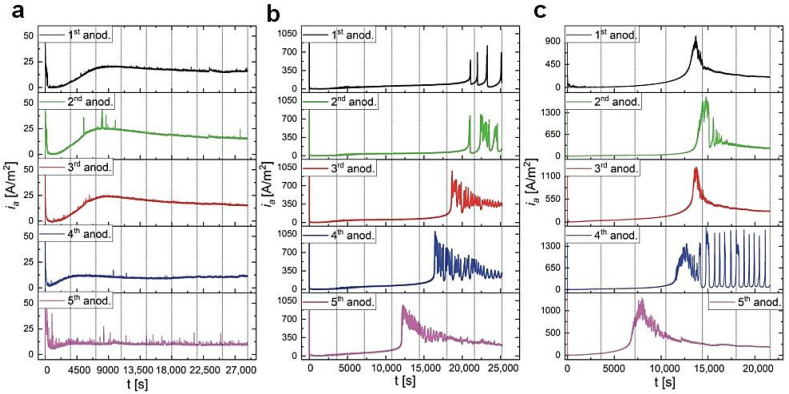
Figure 5.
ia(t) curves recorded during anodization of aluminum in 0.15 M, 300 V (a), 0.25 M, 300 V (b), and 0.5 M, 250 V (c) malic acid concentrations and at temperature of 5 °C—the corresponding processes were repeated five times in a row in the same electrolyte (vertical dotted lines indicate the subsequent hours of anodization).

