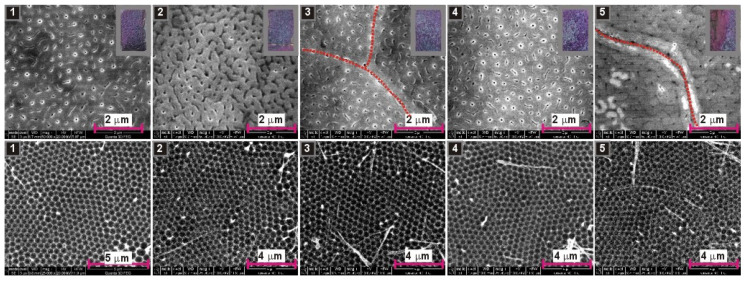
Figure 8.
SEM images of AAO—top view (upper row) and nanoconcaves left on aluminum surface after AAO dissolution (lower row) for the samples anodized for 6 h, at 5 °C, 250 V, five times in a row in the same 0.5 M malic acid solution; in the right corners of the SEM images presented in the upper row, photographs of the samples after anodization are shown (in grey frames).

