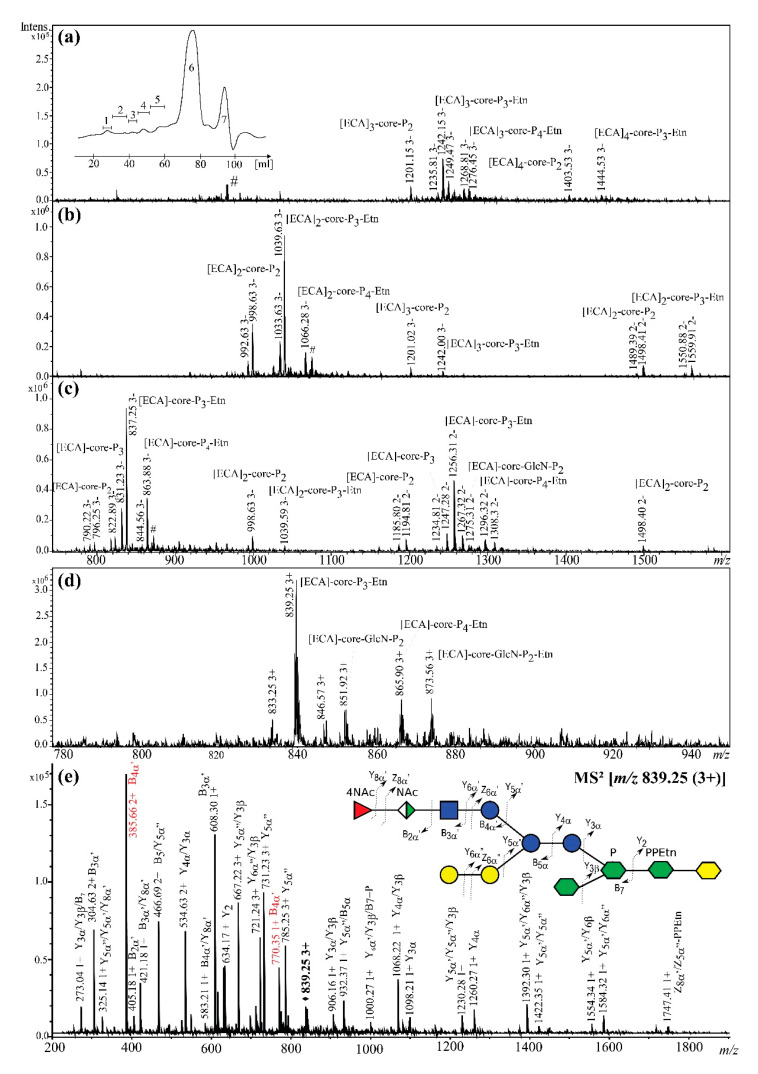
Figure 2.
The electrospray ionization-ion trap (ESI) mass spectra of the [ECA]n-core OS identified in E. coli R1 LOS preparation obtained for (a) fraction 3 (negative-ion mode) with the Bio-Gel P-10 elution profile as the inset; (b) fraction 4 (negative-ion mode); (c) fraction 5 (negative-ion mode); (d) fraction 5 (positive-ion mode). (e) The positive-ion mode ESI-MS2 spectrum of the ion at m/z 839.25 (3+) attributed to [ECA]-core-P3-Etn glycoform, where core stands for Glc3-Gal2-Hep3-Kdo oligosaccharide. The symbol nomenclature for glycans was used for carbohydrates visual representation:  Fucose;
  Mannuronic acid;
  N-acetylglucosamine;
  Glucose;
  Galactose;
  l,d-manno-Heptose;
  Kdo; NAc, N-acetyl group [27]. The interpretation of ions is shown in Table 1. The most informative ions are colored in red. The mark # stands for non-interpreted ions.

