Figure 5.
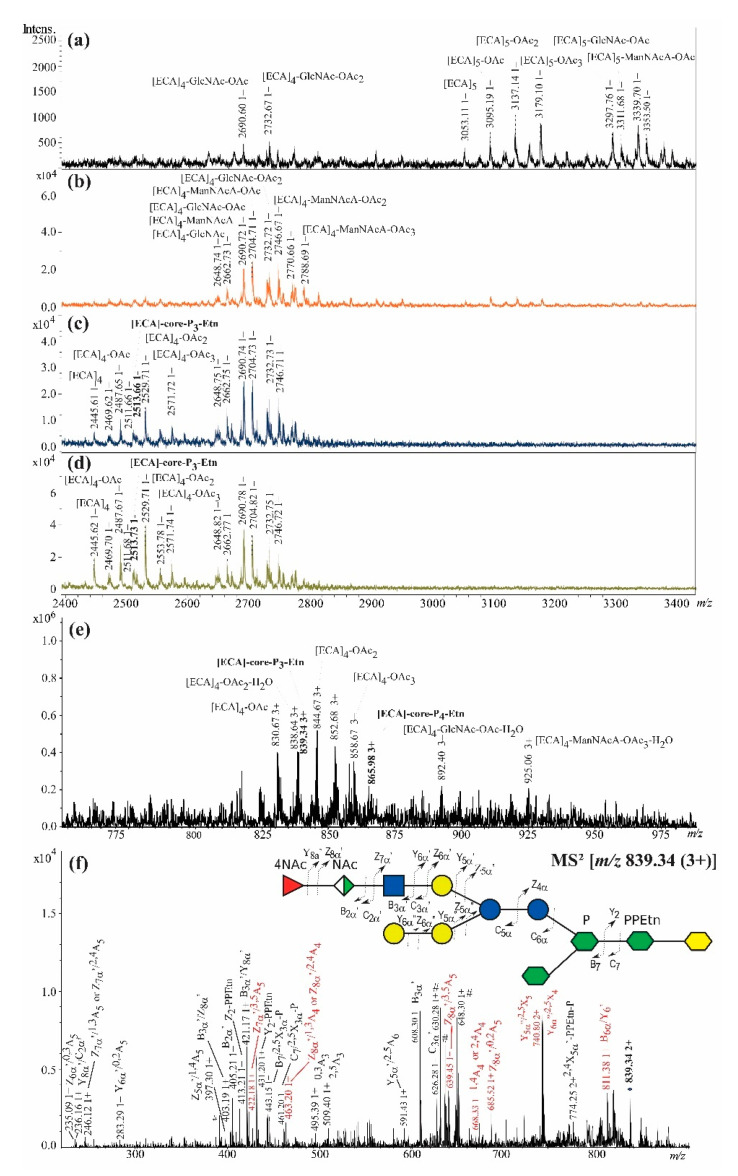
The mass spectra of ECA-containing fractions isolated from E. coli R4 LOS preparation. (a) The matrix-assisted laser desorption/ionization-time of flight (MALDI-TOF) negative-ion mode MS of the fraction 25; (b) the negative-ion mode MALDI-TOF MS of the fraction 26; (c) the negative-ion mode MS of the fraction 27; (d) the negative-ion mode MALDI-TOF MS of fraction 28; (e) the positive-ion mode ESI-MS spectrum of the fraction 28; (f) the ESI-MS2 spectrum of the ion at m/z 839.34 (3+) attributed to [ECA]-core-P3-Etn glycoform, where core stands for [ECA]-Gal3-Glc2-Hep3-Kdo oligosaccharide. The interpretation of ions is shown in Table 4. The most informative ions are colored in red. The mark # stands for non-interpreted ions.

