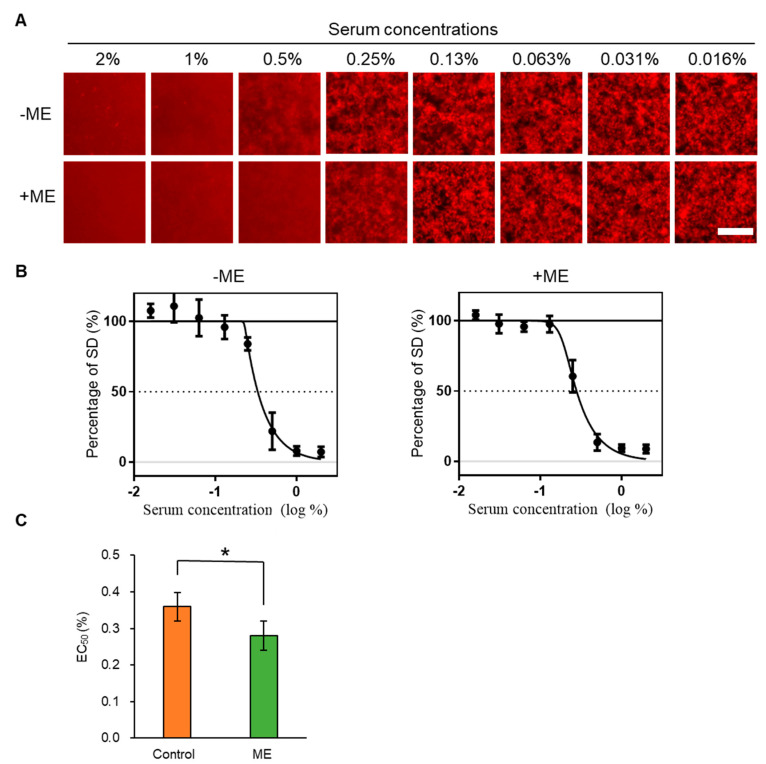
Figure 3.
Estimation of EC50 of serum for amyloid beta (Aβ) aggregation by the MSHTS system. (A) Aβ-containing QD nanoprobes were incubated with various concentrations of +ME or −ME group sera. (B) Estimation of EC50 values from inhibition curves. (C) Comparison of the EC50 values between +ME and −ME groups (* p < 0.05, Welch’s t-test) (n = 3 separate experiments). Each plot and bar graphs represents mean ± SEM.

